
Originating from the Stock Exchange, the term Bulls and Bears is now often used in most financial markets, including the Forex market. As we know, market conditions are constantly fluctuating due to economic situations around the world, but knowing more about Bulls and Bears would help you in profiting from trading in the Forex market.
In Forex, a Bullish currency pair refers to one where its value is rising, whereas a Bearish currency pair refers to one where its value is falling. Bullish markets are upward-moving, whereas Bearish markets are downward-moving.
Today, we shall talk a little about how the Bulls and Bears impact the Forex market and how you can trade under Bullish or Bearish scenarios.
Table of Contents
Bullish vs. Bearish in Forex Trading
Definition
Why are Bulls and Bears called Bulls and Bears?
Having a pair of horns with an upward inclination, Bulls attack their predators or prey with their heads swinging in an upward direction. Hence, the Bull is denoted as the upward movement of the market. Conversely, Bears strike down their paws when attacking their predators or prey. Therefore, the Bear is denoted as the downward movement of the market.
In Forex, Bullish traders expect a rise in the exchange rate, whereas Bearish traders are expecting a fall in the exchange rate. Either way, traders do so to be able to either buy or sell the currency pair for profit.
When does each type of Market occur?
Bull markets have characteristics such as the increase in prices, positive sentiment that are occurring, as well as a positive economic backdrop. The general way to define markets that are Bullish is when a particular asset increases over 20% in price as compared to its most significant recent low. The duration of Bull markets can be as long as months or years.
Bull markets occur in situations where the economy is performing well; the Gross Domestic Product (GDP) is going up and so are the prices. There is optimism, confidence in investment and high expectations.
Contrastingly, Bear markets have characteristics such as a decrease in prices, negative sentiment, as well as an economic backdrop that is weakening. Bearish markets may cause prices to swing violently, which can also last as long as months or years. However, they would generally unfold more quickly.
Bear markets occur in situations where the economy is not performing well, unemployment rates are skyrocketing, the GDP is going down and so are the prices. Prices are falling due to pressure from negative news. There is pessimism and low confidence in the trading of that currency pair.
What does it mean to go Long or Short?
In simple terms, long means buy and short means sell. To go long means that you have purchased a currency pair, whereas to go short means that you have sold a currency pair.
When going long, you would want the market to increase beyond the point that you purchased the currency pair. Conversely, when going short, you would want the market to decline beyond the point that you sold the currency pair.
What if a Pair is not Bullish or Bearish
In a ‘neutral’ situation where a currency pair is neither Bullish nor Bearish, the price’s movement is sideways, where there are minor vertical changes or fluctuations to the market. These conditions are known as lateral trends or sideways drift.
The lateral trends occur in the situations of the prices being within a stable range with no obvious trends (besides the sideway trends). There are no signs of either Bulls or Bears, so the prices are fluctuating horizontally.
How to trade Forex in a Bullish Scenario?
There are 4 major techniques and strategies used by Forex traders in Bullish scenarios.
![]()
Buy and Hold:
An incredibly simple and passive strategy, you can buy and hold a currency pair in order to profit from a Bullish market that is sustained. After establishing a long position, all you have to do is wait for signs of an ending Bullish market.
Increase in Buy and Hold:
This is a strategy similar to Buy and Hold, but slightly more aggressive. More trades are purchased for every level of a certain increment in the price of currency pairs. This can continue up to a certain amount, or when the Bullish market is coming to an end.
Retracement Additions:
Aggressive traders who want to add trades substantially at the best prices will take note of downward corrections or retracements in the Bullish market. There, they will purchase extra trades for profits.
Trading in Full Swing:
The most aggressive technique, trading in full swing will allow traders to constantly buy and sell as the market fluctuates for profit.
Bullish Patterns
You are able to use candlesticks to identify a Bullish pattern. In general, reversal patterns for Bulls should be formed within a downtrend, if not, they are what we call a continuation pattern. These reversal patterns need a Bullish confirmation that is subsequently an increase in price movements.
Some examples of Bullish patterns using candlesticks include the Hammer, the Inverted Hammer, the Bullish Engulfing, the Piercing Line, the Morning Star, as well as the Three White Soldiers.
You can click on the respective hyperlinks above if you wish to find out and understand more deeply how you are able to trade using these candlestick patterns!
Indicators
The most common indicator used by traders who are trend trading would be the Moving Average Convergence Divergence, also known as the MACD. The MACD is a type of oscillating indicator, which is an indicator used for technical analysis. The MACD varies over a period of time, fluctuating either above or below the zero line. You can learn more about how you are able to use the MACD indicator when trading.
An example:
We will now have a look at an example of a Bullish pattern, together with the MACD graph:
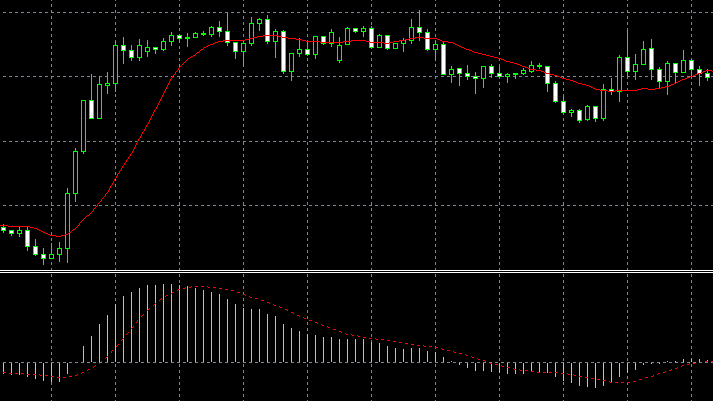
As seen in the graph above, the Bullish pattern here is rather obvious, where there are the Three White Soldiers rising sharply before making a slightly Bearish pattern. Prior to the Three White Soldiers, the Evening Star is seen with a Bearish pattern.
The general trend lines of the graph are marked in red. The MACD indicates a similar trend that has occurred in the past and as we can see, the trend predicted by the MACD is rather accurate.
How to trade Forex in a Bearish Scenario?
There are 3 major techniques and strategies used by Forex traders to survive under Bearish conditions in the market.
![]()
Buying Short-Term and Long-Term Puts
You can buy more affordable short-term and long-term puts.
Selling Naked Puts
You can sell naked puts that other traders intend to purchase in hopes that it expires worthless so that you profit through holding the whole premium.
Searching for Assets that increase values
You can research on historical Bearish markets to find out more about currency pairs that can go up while the market is going down.
Bearish Patterns
Just like in a Bullish scenario, you are able to use candlesticks to identify a Bearish pattern. Some of the Bearish formations with candlesticks include the Bearish Dark Cloud Cover, the Evening Star and the Three Black Crows.
You can learn more about trading with the Japanese candlesticks here!
Indicators
Similar to the Bullish scenario, you can use the MACD indicator to help you trade in a Bearish market as well. The MACD will help you when trading as it is designed to show the changes of the trend of the currency pair. With the MACD, you can identify a Bearish pattern when it occurs and prepare to conduct the necessary trades.
An example
We will now look at an example of a Bearish pattern, together with the MACD graph:
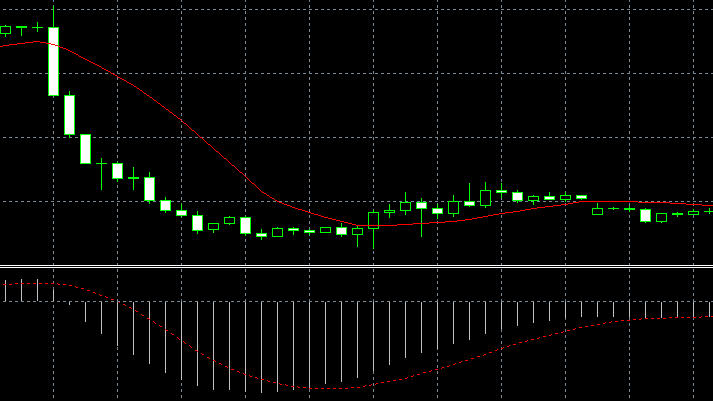
As seen in the graph above, there is an obvious Bearish pattern, with the Three Black Crows indicating the fall in prices, though they aren’t really black in this graph. Following the fall, the price does not go back up yet, instead forming a lateral trend.
Just like the example for the Bullish movement, the trend lines are marked in red. Similarly, the MACD indicates a similar shape as compared to the graph shown above. These two graphs are actual trading scenarios from the MT5 trading platform, so you should bear in mind that these are some of the Bullish and Bearish patterns that you would definitely encounter while trading in the Forex market.
Frequently Asked Questions
Is it better to buy Bullish or Bearish?
It really depends on your preference. When buying Bullish, you want the market to keep rising before you sell the currency pair at the peak of the Bullish market. However, when going short, you want the market to fall as much as possible before buying in hopes that there would be a Bullish trend afterwards.
If you trade in the Bull market, you are most likely confident in the backdrop of the market so you would probably be interested in trading or holding positions for a longer period of time. However, trading in the Bear market would mean that you would be worried since there would be an uncertainty of falling prices. There is a lot of volatility here.
It is better to buy what you’re comfortable with. If you want more stability when trading, then go for the Bulls, but if you want to spice up your trading a little bit, then you can try out the Bears.
What is a Bullish Divergence?
A Bullish divergence refers to the pattern occurring when prices of a currency pair declines to lower lows, but the technical indicator hits higher lows.
A Bullish divergence is a sign of a strengthening market momentum. The currency pair may experience an increase in prices to follow the technical indicator. Following the pattern of a Bullish divergence, a rapid increase in prices is often seen.
What is a Bearish Divergence?
A Bearish divergence refers to the pattern occurring when prices of a currency pair hits higher highs, but the technical indicator reaches lower highs.
A Bearish divergence is a sign of a slowing market momentum. Although it appears that the market is experiencing a Bullish attitude, this is on the contrary. That being said, a rapid drop in prices is highly possible following a Bearish divergence.
What is a trend?
A trend in the Forex market is when there is a tendency for the prices of currency pairs to move in a certain direction over some time.
Trends of the prices of a currency pair can be for both long term or short term. The prices can have an upward trend, Bulls, or a downward trend, Bears. You can make use of trend lines as a form of technical analysis to determine the trends in the market in order to perform better when trading.
Find out more about the different types of trends here.