
Have you ever wondered to yourself how to calculate EXACTLY what % of your account balance to risk on a given trade?
I mean you’re sitting there, about to open a trade for what seems to be a good opportunity, but you’re not sure what the optimal volume / lot size is. On one hand, you don’t want to risk too much in case the market goes against you, but on the other hand, you don’t want to risk too little either. Sound familiar?
That’s what we are going to explore today – EXACTLY what % of your balance is it optimal to risk on a given trade. It’s going to be fun!
Favourable Coin Toss
Let’s imagine that we are playing a game: you bet $1 on a coin flip. Rules are:
- On heads I pay you $2;
- On tails you lose your $1
Sounds like an incredible opportunity, right?
From a mathematical perspective the Expected Value (EV) of this investment can be calculated as:
EV = $2 * 0.5 – $1 * 0.5 = $0.50
A positive EV indicates a profitable opportunity. What it means is that in the long run, if you average out all the tosses, then the player (you) will be earning an average of 50 cents per coin toss.
This coin toss game is great analogy for a profitable trading strategy – e.g. where the TakeProfit = 2 x StopLoss, and the frequency of profitable and loss trades is roughly the same. Obviously a great trading strategy!
You are KING!! You cannot lose this one!
Actually, not. Turns out you can lose even in a favourable game like this…… In comes Money Management…
Wrong Money Management
Let’s say that you only have $100 to play this game. And because it’s such a great opportunity you decide that at any given point in time you will bet 75% of your funds. Let’s see how this will play out for you:
First toss:
- you bet 75% x $100 = $75
- it’s heads! – you just earned $150
- your balance is now $250
Second toss:
- you bet 75% x $250 = $187.50
- it’s tails! – you just lost $187.50
- your balance is now $62.50
So you see now that after only two tosses you are already in the negative. And since Heads and Tails come in with roughly the same frequency, in the long run this pattern will continue and you will lose all your money!! Shocking!

PS: Heads-Tails or Tails-Heads – order doesn’t matter, check for yourself.
What did you do wrong? :<
You over-betted!!
Kelly Criterion
Let’s see what happens to your account balance if you choose to bet a different % of your balance (I challenge you to check these numbers):
- 10% -> $108
- 20% -> $112
- 30% ->$112
- 40% -> $108
- 50% -> $100 (you break even)
- 60% -> $88
- 70% -> $72
- 80% -> $52
- 90% -> $28
- 100% -> $0
Can you see the pattern? The return increases, drops off, then goes into negative. So that means there has to be a maximum somewhere between 20% and 30%.
This is where the Kelly formula comes into play:
K = ( PxB – (1–P) ) / B
where:
- K – optimal % risk
- P – odds of winning
- B – payout on the bet
This formula determines the optimal % of your account that you can bet to get the most profitable outcome in the long run. Let’s calculate K for our scenario:
- B = 2 (payout is 2:1)
- P = 0.5 (50% chance of winning)
Plugging B and P into the formula gives:
K = (0.5*2 – (1 – 0.5)) / 2 = 0.5 / 2 = 0.25
Therefore, the best outcome in the long run is achieved by betting 25% of your account on every coin toss!
- 25% -> $112.50 (after 1 heads and 1 tails)
Indeed, this outcome is better than anything we calculated prior.
Note: this percentage is called one Kelly and for every trading strategy the exact value can be different.
Kelly’s Chart
Kelly’s criterion is a good start, but it’s not the full picture. If you visualize the relationship between balance growth and the % of risk, it will look like this:
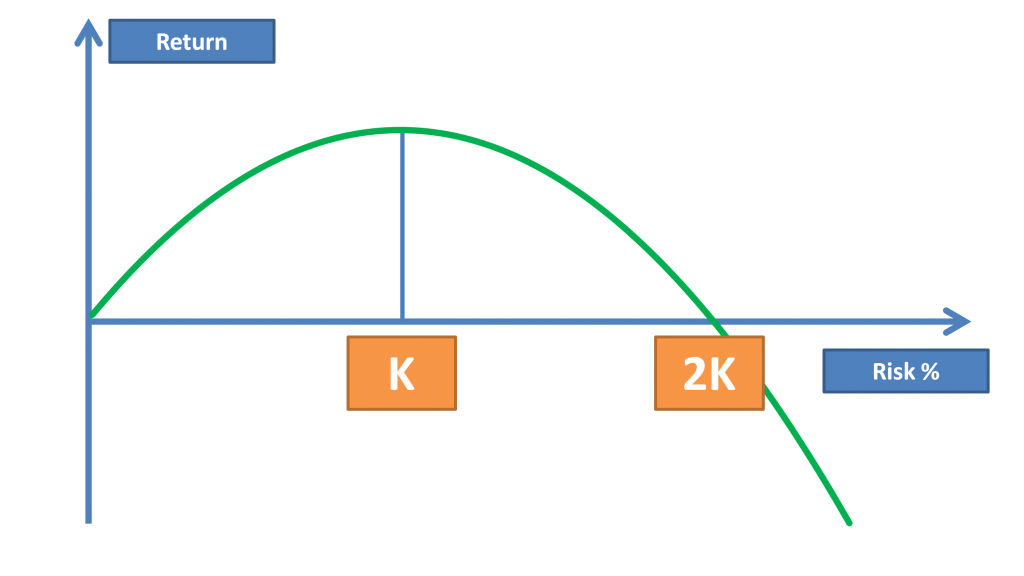
From here we can witness the same pattern as we noticed before – to the left of one Kelly return increases as you increase risk. Then return drops off and becomes zero at 2K. After 2K you are bound to lose your investment in the long run.
The best part is that this chart always holds – for any strategy!!
As long as you have calculated your Kelly correctly, you can draw up a chart like this for your specific case and understand how your investment will behave in the long term depending on your selected risk exposure. Let’s talk more about that.
Sub-Optimal Risk Taking
We already know that in an ideal scenario you are best taking the approach of betting EXACTLY one Kelly. However, the world is not always ideal, so now we will analyse the Kelly chart and understand the implications of sub-optimal betting (i.e. not one Kelly).
I like to break up the Kelly chart into four sections:
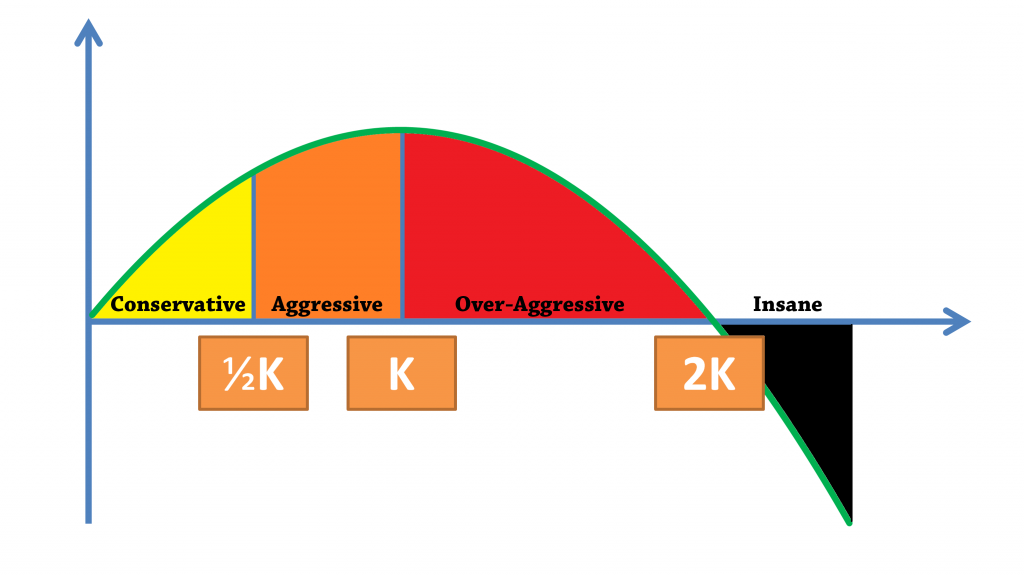
- Yellow: from Zero to 1/2 Kelly is the Conservative risk area
- Orange: 1/2 Kelly to 1 Kelly is the Aggressive risk area
- Red: 1 Kelly to 2 Kelly is the Over-Aggressive risk area
- Black: Anything above 2 Kelly falls in the Insane risk-taking area
Conservative Risk-Taking
Half-Kelly is a surprisingly cool number. The fact of the matter is that sometimes the Kelly formula can give you quite high values, for example 25% risk. Even though theoretically this may be the optimal risk exposure, in practice it may be too high.
Reasons include things like a possibility of a string of consecutive losses which are not adjusted for in the Kelly Criterion as well as balance volatility which we will talk about in another article (I will post the link HERE when I publish it). In short, there are legitimate reasons why you may think your Kelly is too high. That’s when we look at the Half-Kelly.
The main reason why the Half-Kelly is so great is because it halves your risk but the long-term return only goes down by 25%. You can even see it from the chart. Other reasons include a reduction in balance volatility by more than 50% and a larger margin of safety in your risk estimate. More on that here.
If you are trading below the Half-Kelly then you are being quite conservative. Which may be a good thing for risk-averse investors or if you are in control of a very large balance.
Aggresive Risk-Taking
Anything between Half-Kelly and a Full Kelly is deemed Aggressive risk-taking.
Your returns are higher, but not much higher. Consider our example with the coin flip game: risking 20% (4/5 Kelly) took our balance to $112, and risking 25% (Full Kelly) took our balance to only $112.50.
That’s only an extra 0.5% (50 cents over $100) profit for a 5% increase in risk. Is it really worth it? That’s why we associate this area with Aggressive risks.
Over-Aggressive Risk-Taking
For any long-term return that you are going to get by betting in the red area, there is a matching return in the yellow and orange areas. So naturally, why would you EVER set your risks in the red area.
Allow me to clarify..
If you are looking at ONE single trade, then of course, if you win – the more you had risked, the more will be your return. However what we are looking at here is lots and lots of trades – the Kelly Criterion works in the long run.
Therefore, what the Over-Aggressive risk zone is telling us is that in the long run there is no need to risk such a large % of your balance. You can achieve the same outcome by risking less.
Question: “But what if I don’t have a systematic trading strategy? What if all my trades are different and ad-hoc? In that case the Kelly Criterion does not apply??”
Answer: Get a trading strategy. Then come back and read this article.

Insane Risk Taking
The title and the chart speak for themselves. If you are in this zone – get out now!! The only other alternative is a margin call.
A good example of insane risk taking was when we bet 75% of our balance in the coin-tossing game. There 2 x Kelly was equal to 50%. So we were definitely in the insane zone, and you saw for yourself how quickly the balance went down.
How is this applicable to Forex Trading?
Very easy. But you have to have a trading strategy for this to work.
If your trading strategy has a fixed StopLoss and TakeProfit, then you are in luck my friend! For you the value of B equals to TakeProfit / StopLoss (don’t forget to subtract / add the spread if it’s not included in your TP / SL).
You now have B, all you have left to find out is the value of your P parameter.
To get P you need to look at your history of trading in similar market conditions. I recommend checking the past 100 trades just to be certain.
See what % of trades are winners. That will be your P.
Now that you have both B and P – plug them into the Kelly formula and see what you get. Oooohhh…… Exciting!
My K is negative. What does this mean?
If your K is negative, then your trading strategy is a bad trading strategy. You will lose in the long run.
Get a new trading system.
Example
Let’s look at a trading example.
Say, you have a EURUSD trading strategy that wins approximately 70% of the time. The StopLoss in your strategy is 40 pips and the TakeProfit is 20 pips (spread accounted for).
This means that your B and P parameters are as follows:
- B = 20 pips / 40 pips = 0.5
- P = 70% = 0.7
Let’s input these values into Kelly’s formula and see what we get:
K = ( PxB – (1–P) ) / B
K = ( 0.7 x 0.5 – (1–0.7) ) / 0.5 = 0.1
This means that the optimal risk for this trading strategy that will maximize your profits in the long term is 10%.
If you want to be a bit more conservative, then go with the Half-Kelly of 5%.
Whatever you do, don’t invest more than 10% per trade – it’s pointless.
If you invest more than 20% then you will turn this great strategy into one that will ruin your account.
That’s how you apply the Kelly Criterion in practice.

Till soon, my friend!
Kirill