Most traders love continuation figures like the triangle pattern; this makes it one of the most commonly traded chart formations in Forex. Unlike reversal patterns that signal an impending change in the trend direction, triangles are used to make profits in trend extensions.
The Triangle Pattern in Forex is a price formation that signals a potential trend continuation after a brief consolidation. In general, there are three types of triangle patterns: Ascending, Descending, and Symmetrical. When trading this pattern:
- Be mindful of the trend direction previous to the triangle formation.
- Place your trade only if the candle closes outside the triangle.
- Use the widest distance of the triangle to set the Take Profit level from the breakout.
This blog post will teach you everything you need to know about the triangle pattern. Also, we will look at the structure of triangles, their advantages and limitations, and what they represent in the market.
We will share real charts and show you how to trade triangle patterns and make profits. Our tips will show you how to minimize the risk and maximize the return on triangle setups.
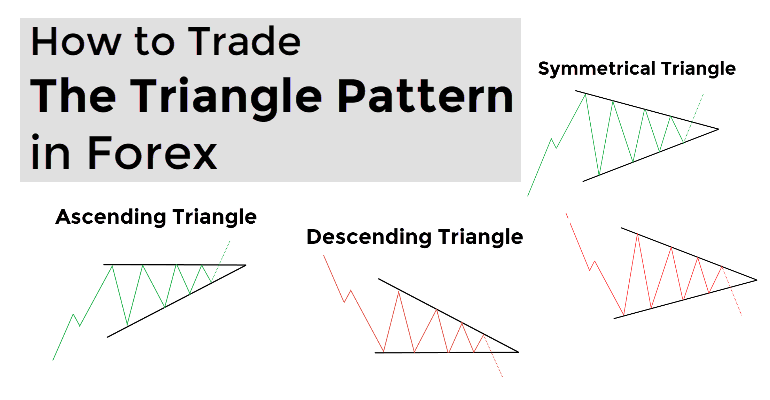
Table of Contents
Triangle Chart Pattern in Forex – The Fundamentals
Triangles are generally considered to be continuation patterns. For the triangle to exist in the first place, the consolidation phase must originate from a clear trend. This way, the triangle is used as a reference to confirm the trend continuation in the same direction after a short pause.
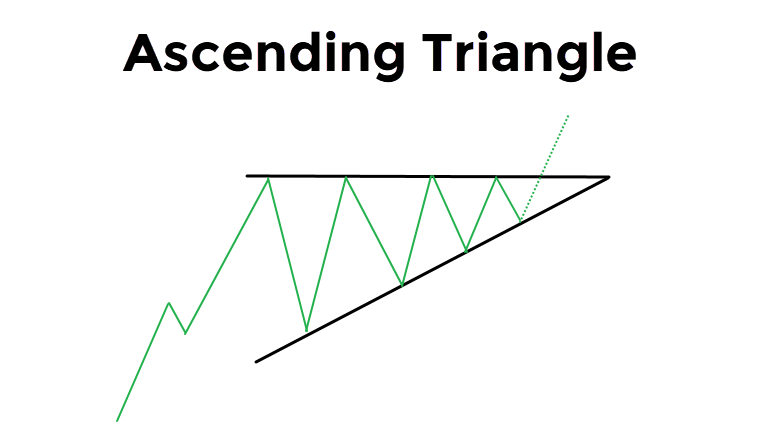
- The ascending (bullish) triangle takes place in a mid-trend as the two trend lines converge. The upper trend line should be (almost) flat, while the lower trend line should be pushing the price action higher until it nearly converges with the top line.
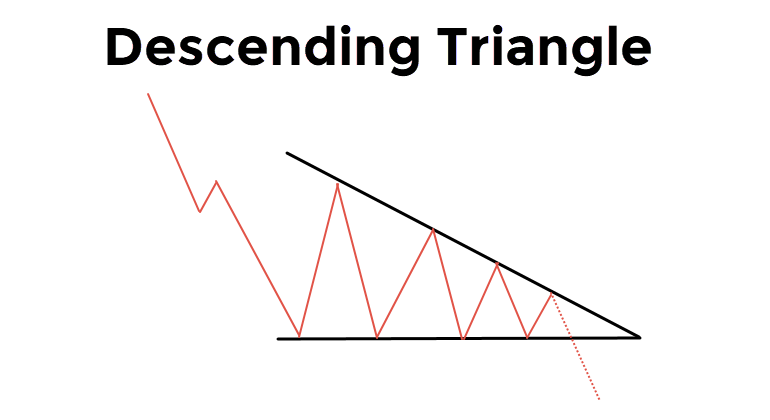
- The descending triangle is designed in the same way, except that it is a bearish formation. The supporting line is flat, while the upper line squeezes the price from the upside.
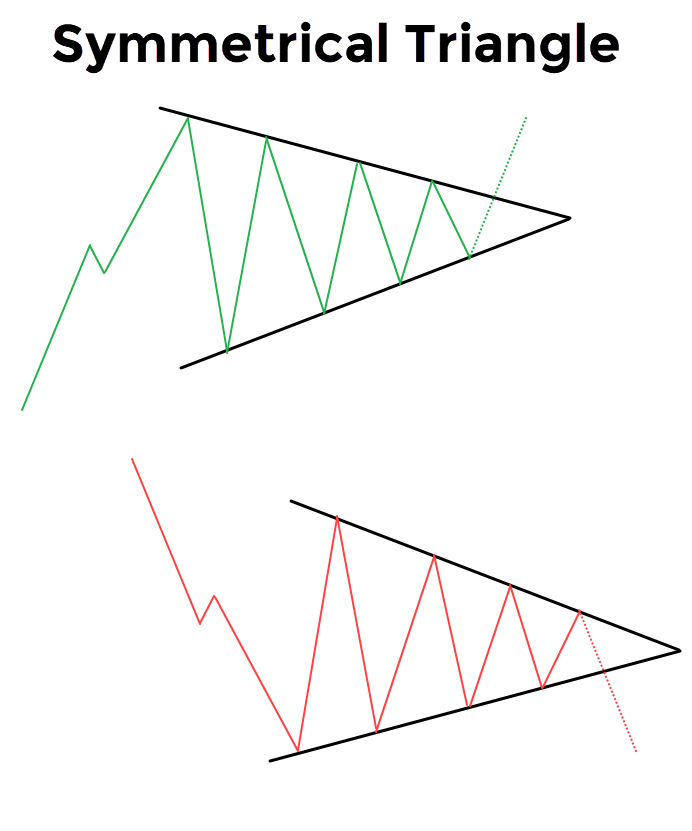
- Then we have the symmetrical triangle that can be both neutral and a continuation chart pattern. Two trend lines are nearly symmetrical as the price action consolidates its energy until the breakout occurs.
Given its rather simple design of only two trend lines, the triangle is a widespread chart pattern. With its three versions – ascending, descending and symmetrical – it covers a lot of ground. Each of these has a clear function and that is to help the dominant market side extend its reach higher or lower.
All three versions are activated once the breakout takes place. Before this happens, we are only talking about the triangle in the making. Thus, it is important not to rush and start trading the triangle before it actually becomes a triangle. This is because what looks like a descending triangle may not prove to be in the end. Hence, wait for the breakout to take place.
Each of the versions detailed below consists of three main elements:
- A Clear trend: a dominant market movement pushed the price in one of the two directions before the consolidation takes place.
- Consolidation: there is a pause and the strength in the trend decreases, which is the time when consolidation takes place.
- Breakout: the trend resumes and ends the consolidation phase with a clear break of the resistance or support levels.
Types of Triangle Patterns
As mentioned before, there are three main versions of the triangle chart formation. The ascending and descending chart formations are typical continuation patterns. On the other hand, the symmetrical triangle can sometimes end in a reversal, although in the majority of cases, the trend will continue in the same direction.
Ascending Triangles
The ascending triangle is a bullish chart formation. The space between the two trend lines slowly gets narrower as the lower supporting trend line squeezes the price action higher. As the higher lows are characteristic of the bullish price movements, the buyers are in control, with each low printed at a higher level.
Ultimately, the price action bursts higher above the flat upper trend line, activating the ascending triangle formation. Therefore, the triangle part takes place in between the first leg (what precedes the triangle) and the overall trend continuation(what takes place after the breakout happens).
Ascending Bullish Triangle
As seen in the illustration above, the ascending triangle consists of three phases. The middle step (price consolidating in between two black lines) is what the ascending triangle is. This is where the energy compounds before the breakout occurs.
The key idea behind the ascending triangle is that the chances of the bullish continuation are higher than the reversal. There are no hints or signals that the market is about to reverse as the consolidation phase is only used for the dominant market force to take a breathe and regroup.
Despite the brief corrections, the buyers are still in full control of the price action.
This is where the most significant advantage of the ascending triangle lies. The breakout that ends the consolidation phase generates a signal that the dominant market side is ready to continue in the same direction.
This should be seen as a hint to “ride the trend”. A breakout like the one below helps us clearly define the trading setup with an entry, stop loss, and take profit.
However, no single chart formation is perfect. The false breakout may prompt us to enter the trade before the market makes a U-turn and reverses. Therefore, it is suggested to consult other available technical indicators before entering the market.
Descending Triangles
Descending triangles are bearish chart formations that occur during a mid-trend. In essence, their shape and design very similar to that of the ascending triangles, except for the fact that descending triangles are bearish formations.
In this case, the lower trend line is the one that supports the price action as the upper trend line increases the pressure with each new lower high. Ultimately, the pressure is too big to handle and the break of the support takes place to activate the descending triangle pattern.
Descending Triangle
On the left side of the illustration, you see the downtrend in place, which is interrupted by the first bounce from the horizontal support (the first green line). Each subsequent rebound is weaker, as the dominant side – the sellers – turns up the heat.
The descending triangle shares the same advantages and limitations of the ascending one. In essence, this chart formation helps traders to define the risk and return to the trading setup. This is done with the help of a breakout and the lower supporting line.
On the other hand, some descending triangles end up being reversals after the failure of sellers to extend the downtrend.
Symmetrical Triangles
Unlike the prior two versions of triangles, the symmetrical triangle consists of two converging trend lines. Neither of these is flat, which makes the symmetrical triangle both a neutral and continuation chart pattern. The likelihood of a trend continuing in the same direction as before the triangle was created is very high.
The symmetrical triangle can be initiated by both an uptrend and a downtrend. During the second phase, the price action consolidates between the two converging lines, while the market makes a series of higher lows and lower highs. Finding a perfectly symmetrical triangle is impossible as either one of the two lines is usually mildly bent.
This type of triangle has two versions: bullish and bearish. The former is initiated by the uptrend and ends in the continuation of the overall trend. The latter starts with a downtrend and ends with a break to the downside.
Bullish and Bearish Symmetrical Triangles
In these two cases, a symmetrical triangle is a continuation pattern. It has the same function as the ascending and descending triangles: it helps prevailing trends to continue.
If the symmetrical triangle is initiated by the sideways price action, with no clear directional bias, the triangle is then a neutral chart pattern. The chances of a break higher or lower are around 50:50.
Triangles vs. Wedges vs. Pennants
Triangles share a similar shape with wedges and pennants. You must ask yourself how does one tell the difference between these three. There are two critical differences between these two chart patterns.
First, wedges are reversal patterns. The consolidation phase is a tool to reverse the trend direction, not to extend it. A rising wedge is a bearish chart formation, while the falling wedge is a bullish pattern.
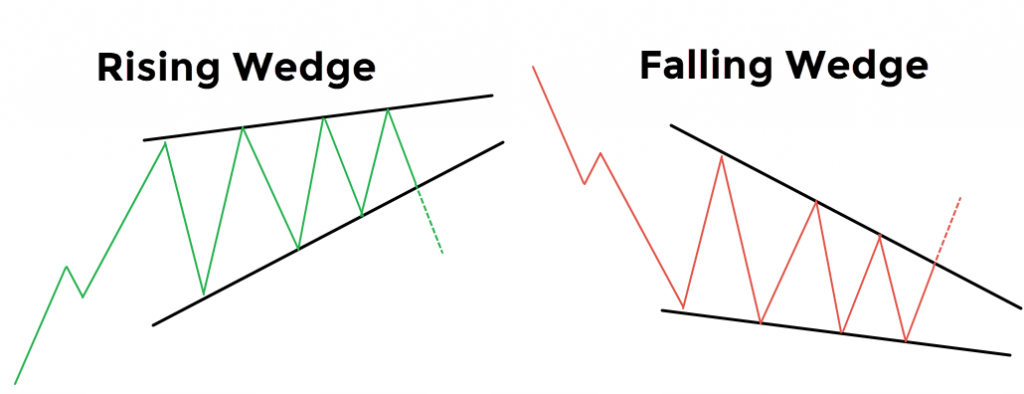
Rising and Falling Wedge Pattern
Secondly, as you can see from the illustration below, wedges have no flat trend lines. In a rising wedge, both are slightly pointing towards the upside. The same case is with the falling wedge – there’s no horizontal support, but rather a descending diagonal trend line that supports the price action.
When it comes to pennants, the differences are harder to spot. As you can see from the illustration below, pennants are symmetrical triangles. The critical difference is in the duration of the consolidation phase. With pennants, the length is rather short, unlike the symmetrical triangles that can last much longer.
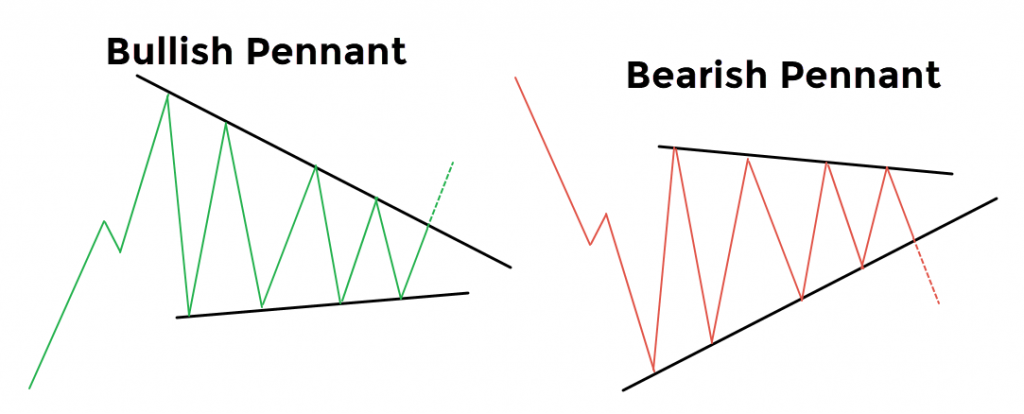
Bullish and Bearish Pennants
Moreover, pennants are preceded by a flag pole (the initial trend). This is a mandatory element of this chart formation. On the flip side, the symmetrical triangle is centered on the consolidation phase.
How to Draw and Trade the Forex Triangle Patterns
After familiarizing ourselves with triangles’ structure, we now move to learn how to spot, draw, and trade triangle patterns. The break of the upper/lower trend line generates a signal for the trade. At this point, there are two options as to where they enter the market.
A trader can consider entering the market as soon as the breakout candle closes outside of the triangle. In other words, when the breakout is confirmed. A different option is to wait for the price action to confirm the break and then return to retest the broken resistance/support.
The former gives you a safe entry as you can’t miss a trade. However, the closing candle can have its close far away from the breaking point, which isn’t helping with the risk-reward ratio. On the other hand, the latter is perfect from the risk management perspective. However, the throwback (the retest) may never take place.
Example: Trading the Ascending Triangle
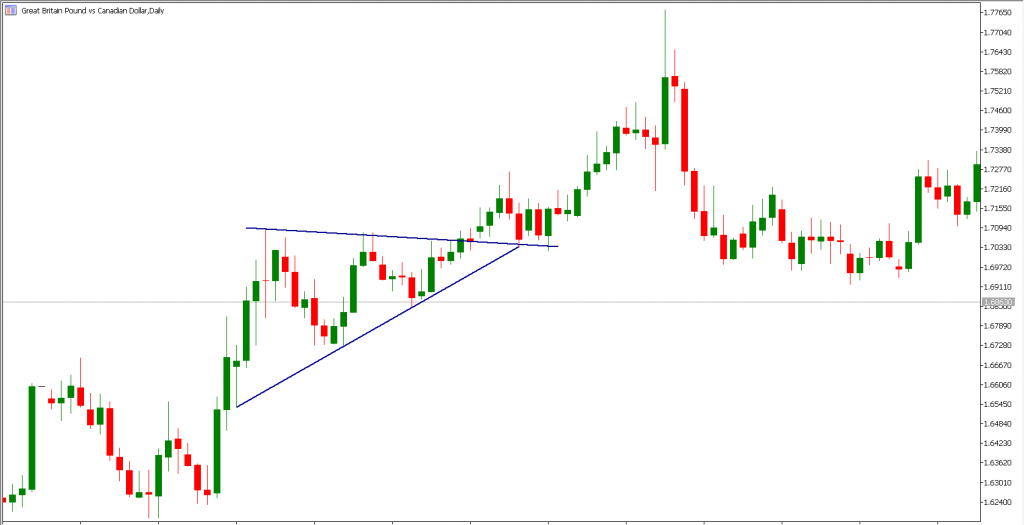
As outlined earlier, the ascending triangle consists of two trend lines, where the upper is flat, and the lower is shooting higher. In the GBP/CAD daily chart below, we see the price action moving higher.
The consolidation phase then occurs with the resistance trend line nearly flat, while the supporting line is connecting the higher lows. After multiple attempts to break higher, the buyers are finally successful in breaking the resistance, paving the way for higher levels in GBP/CAD.
Drawing the Ascending Triangle
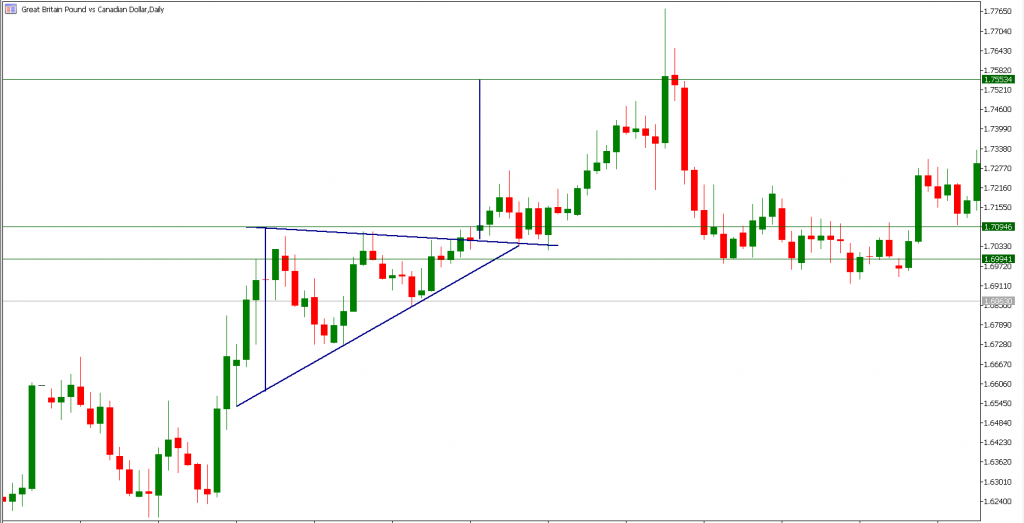
Therefore, the break signals that the buyers have forced an end to the consolidation phase and the market is ready to move higher again. Ultimately, the market presents us with both options for the entry as the throwback took place.
Trading the ascending Triangle
Let’s assume that you chose to enter the trade as soon as the breakout candle closed above the daily chart’s resistance line. The middle green line signals an entry, while the lower horizontal line, located inside the triangle, generates a level for stop loss, in case the market reverses and ends in a failed breakout.
By measuring the distance when the triangle was first formatted, we calculate the take profit level. Finally, the market hits our take profit order and we collect our profits. Ultimately, the risk-reward stands at 1:4.5, which means that the risk was 100 pips to make 450 pips.
Example: Trading the Descending triangle
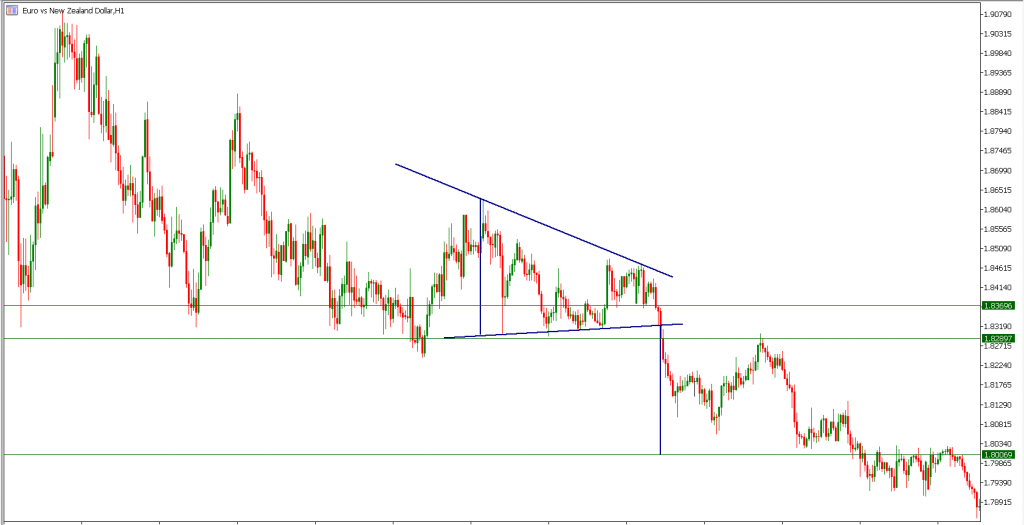
Descending triangles capture the consolidation phase in a mid-trend. As you can see from the EUR/NZD hourly chart below, the price action broke through the flat supporting line after a consolidation period.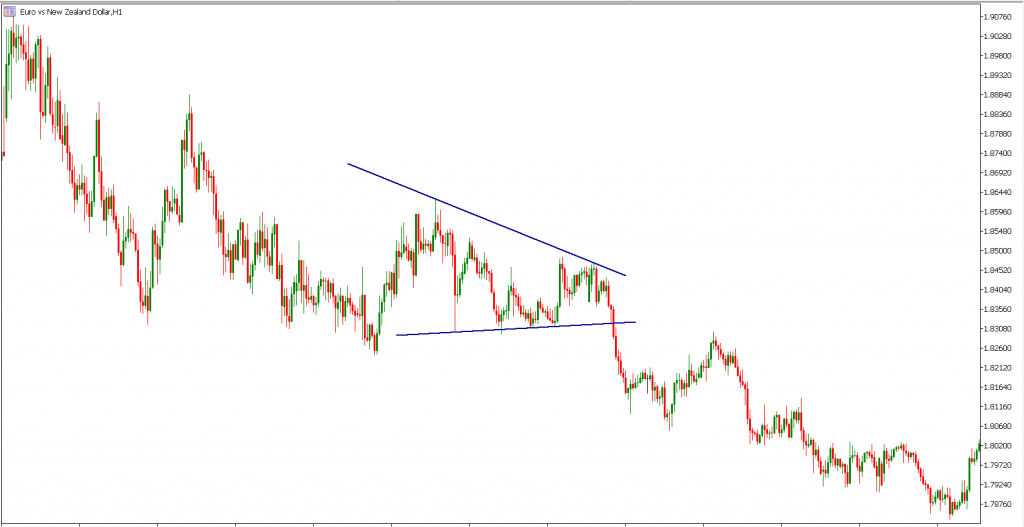
Drawing the Descending Triangle
The triangle was preceded by the downtrend as the sellers took a step back to consolidate recent gains. The upper line is forcing the price action to go towards the supporting line, therefore squeezing the space between two lines.
Trading the Descending Triangle
The break of the lower line generates a signal that the consolidation has ended. Unlike in the previous example, the second option of entry was never presented to us. Hence, you could have only traded this scenario if you had chosen option number one.
An entry was placed at the level where the breakout candle closed with the take profit measured to reflect the distance between two lines at the beginning of a triangle.
The endpoint of this distance signals the level where we should consider collecting our profits. On the other hand, any move back inside the triangle could invalidate the descending triangle formation and stop out the trade.
In the end, there was an opportunity to make in 280 pips after risking 80 pips. Therefore, in this case, the risk-reward is 1:3.5, which is again much better than advised 1:2.
Example: Trading the Symmetrical Triangle
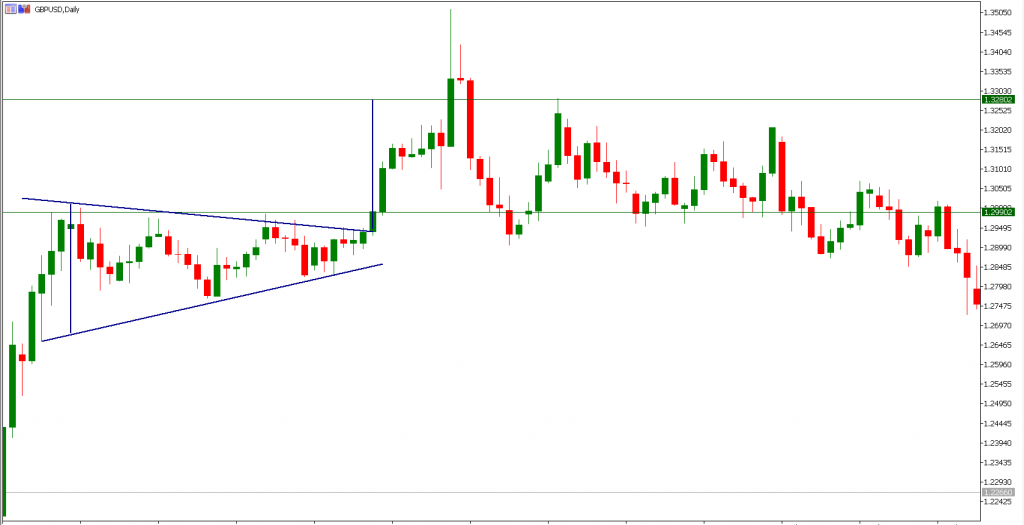
Finally, we will demonstrate how to trade a symmetrical triangle with real charts and setups. In the GBP/USD daily chart below, the price action consolidates within a symmetrical triangle after an impulsive burst higher.
Drawing the Symmetrical Triangle
As the two lines converge, the space between them narrows. Finally, the breakout occurs just before two trend lines intersect. Hence, the break signals that the buyers are ready to resume the uptrend and print higher levels. 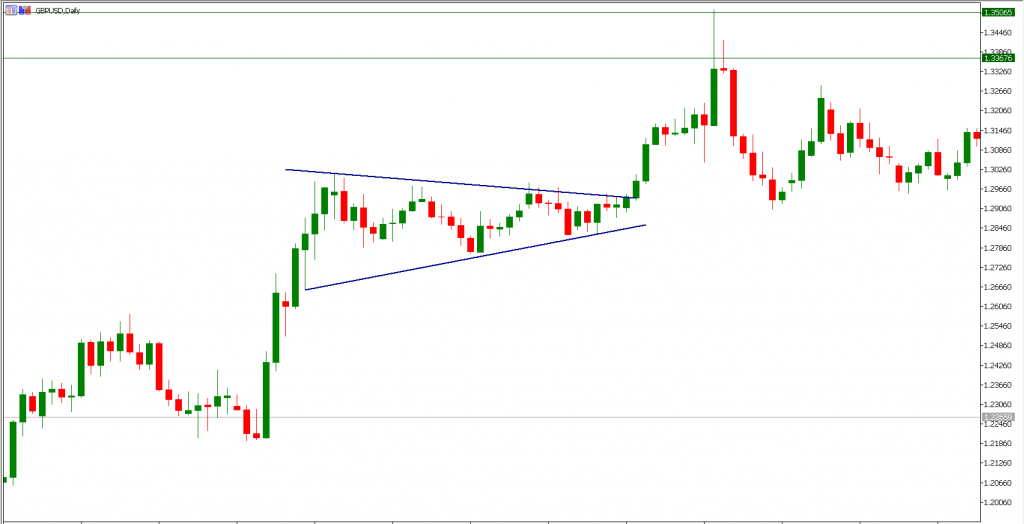
Trading the Symmetrical Triangle
As in the case of a descending triangle, we never got a chance to enter the market on a throwback. This is because the breakout was powerful and the buyers never looked back.
The principles for trading the symmetrical triangle are the same as with two other versions. The blue vertical line is a copy of the measured distance, which provides us with a level to take profits. The Stop loss is placed inside the triangle to limit our losses in case the result is a failed breakout.
After a couple of days, our take profit order has been hit. The end result is 380 pips in the green, while our stop loss (100 pips) was never activated. Ultimately, the risk-reward for this trade is one to nearly four.
Summary
Triangles are continuation chart patterns that signal a likely extension of the overall trend after a temporary pause. There are three types of triangle patterns: ascending, descending, and symmetrical. The ascending (bullish) triangle takes place in a mid-trend with the upper trend line being flat.
The descending triangle is a bearish formation where the upper line pushes the price action to the downside. Finally, the symmetrical triangle can be both neutral and a continuation chart pattern. Two trend lines are nearly symmetrical as the price action consolidates its energy until the breakout occurs.
We demonstrated the best use case for trading triangles. They could be incredibly profitable chart patterns once executed by the book. Their most significant advantage is that they provide us with critical elements of a trading setup: entry, stop loss and take profit. As seen in the examples, the risk-reward when trading triangles is usually very attractive.
