Trading strategies based on Japanese candlesticks represent one of the more popular trading techniques today. There are numerous candlestick trading strategies available today that are used by successful traders. One of them is the Harami. The Harami candlestick pattern is a trading strategy used to identify potential trend reversals or continuation in the price action. […]
The vast majority of traders have learned to trade with candlesticks, line charts, and bar charts. This is a standard trading setting that welcomes novice traders to make sure their familiarization with charts is as smooth as possible. Heikin Ashi, which stands for “average bar” in the Japanese language, is a technique for reading charts […]
TradingView is one cutting-edge web-based charting platform that is disrupting the trading world with its features. Knowing how to use this platform can give your charts an edge in the market. But before we get into the details, let’s take a sneak peek at how to use TradingView. To use TradingView: Go to the TradingView […]
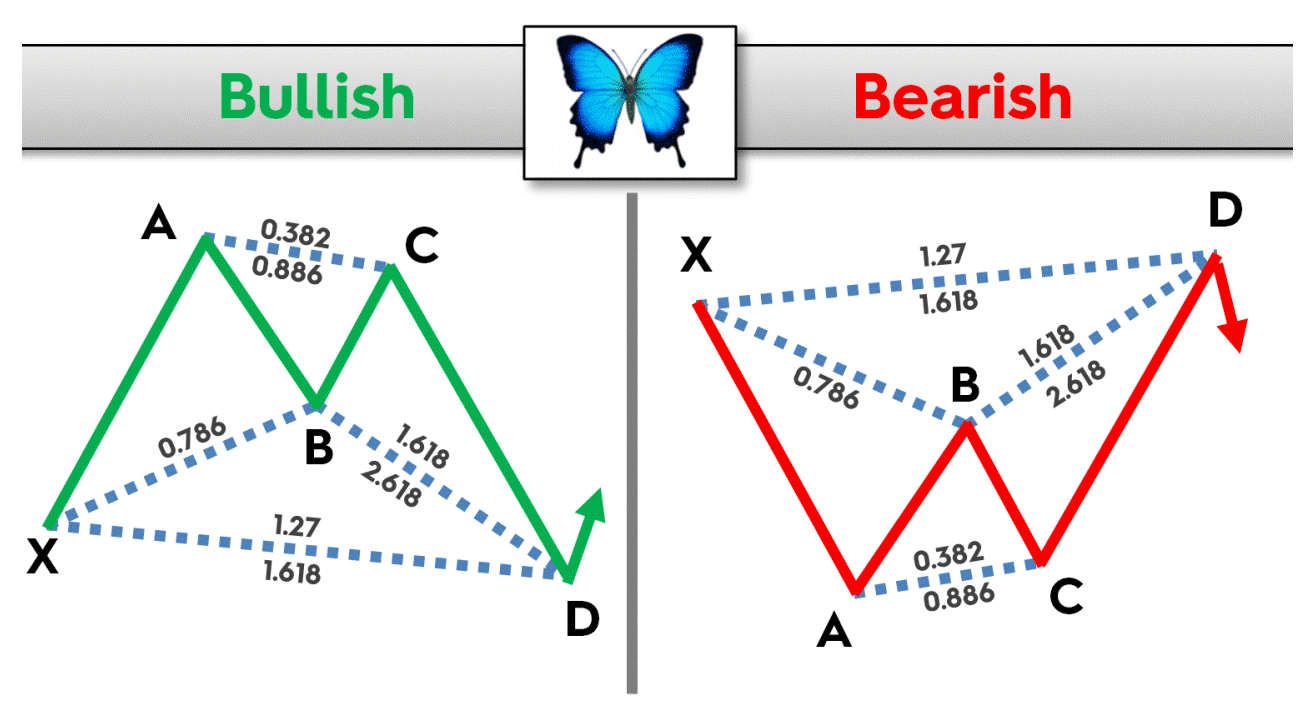
Harmonic patterns are some of the most popular chart formations in Forex. They are characterized by geometric structures that are focused on generating a buy/sell signal for a trader. The Butterfly pattern is defined as a harmonic reversal chart formation. After a series of measured moves, both in the direction of the overall trend and […]
The forex market is fast-paced, so much so that it’s easy to overlook how a winning trade can easily turn into a losing position and leave you with considerable losses. Good thing that a TakeProfit order exists, right? On that note, let’s start by giving a quick answer to the frequently asked “what is a […]
Harmonic chart patterns have grown in popularity in the past few years. Although they are considered more advanced chart patterns, new traders have also shown a strong appetite for learning about how to draw and trade harmonics. The Gartley pattern is defined as a harmonic chart formation that helps traders to generate, buy, and sell […]
With a daily trading volume of over $6 trillion and close to 10 million active traders, it’s clear that the forex market is an attractive investment option. However, forex trading comes with some inherent risk and a stop order is one money management tool many traders rely on to minimize this risk. This leads to […]
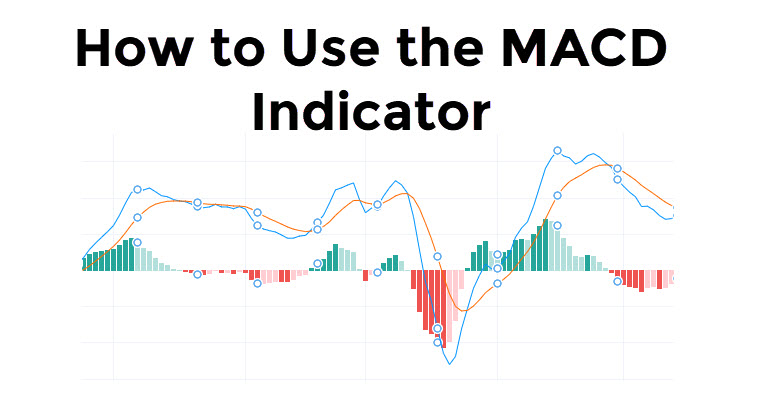
The Moving Average Convergence Divergence (MACD) is one of the more popular momentum indicators used by traders. It is an easy-to-use technical tool used by traders to measure the current market environment. MACD or Moving Average Convergence/Divergence is a momentum indicator that gauges the market conditions to generate overbought and oversold signals. It works in […]
Trend reversals represent one of the most anticipated scenarios in Forex markets. Traders analyze the currency markets, looking for reversal as they usually offer great risk-reward. The gravestone doji is a candlestick formation that points to a likely reversal in the trend direction. The gravestone doji also looks like the letter “T”, but turned upside […]
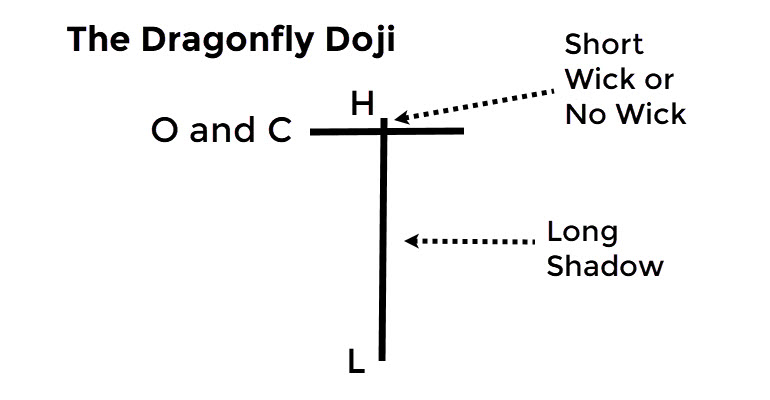
Doji candlesticks are some of the most common candles in price movements. As open and close are the same, or nearly the same, doji candles are usually interpreted as neutral candles, although their appearance near tops or lows can signal impending reversals. The dragonfly doji is one of the more powerful doji patterns. It’s characterized […]