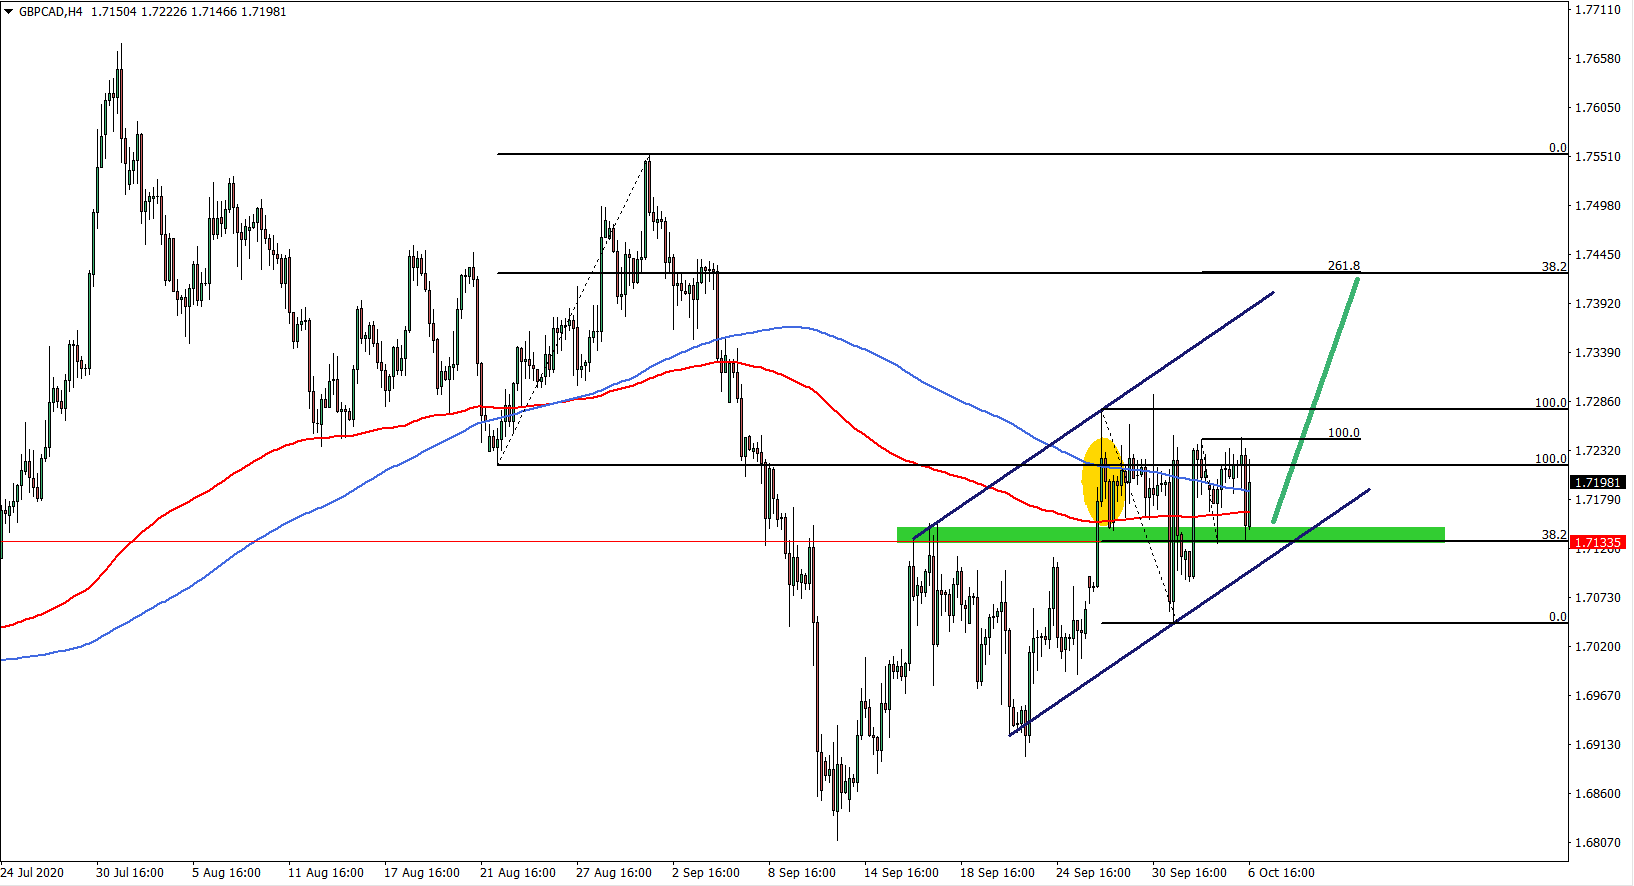
The GBP/CAD has started to produce higher highs and higher lows suggesting the validity of an uptrend… Analysis Details: GBP/CAD symbol on the MT4 platform Type: Bullish Key support levels: 1.7162 Key resistance levels: 1.7246, 1.7277, 1.7424 On September 28th, the price broke above 200 Simple and Exponential Moving Average, showing strong bullish intentions […]
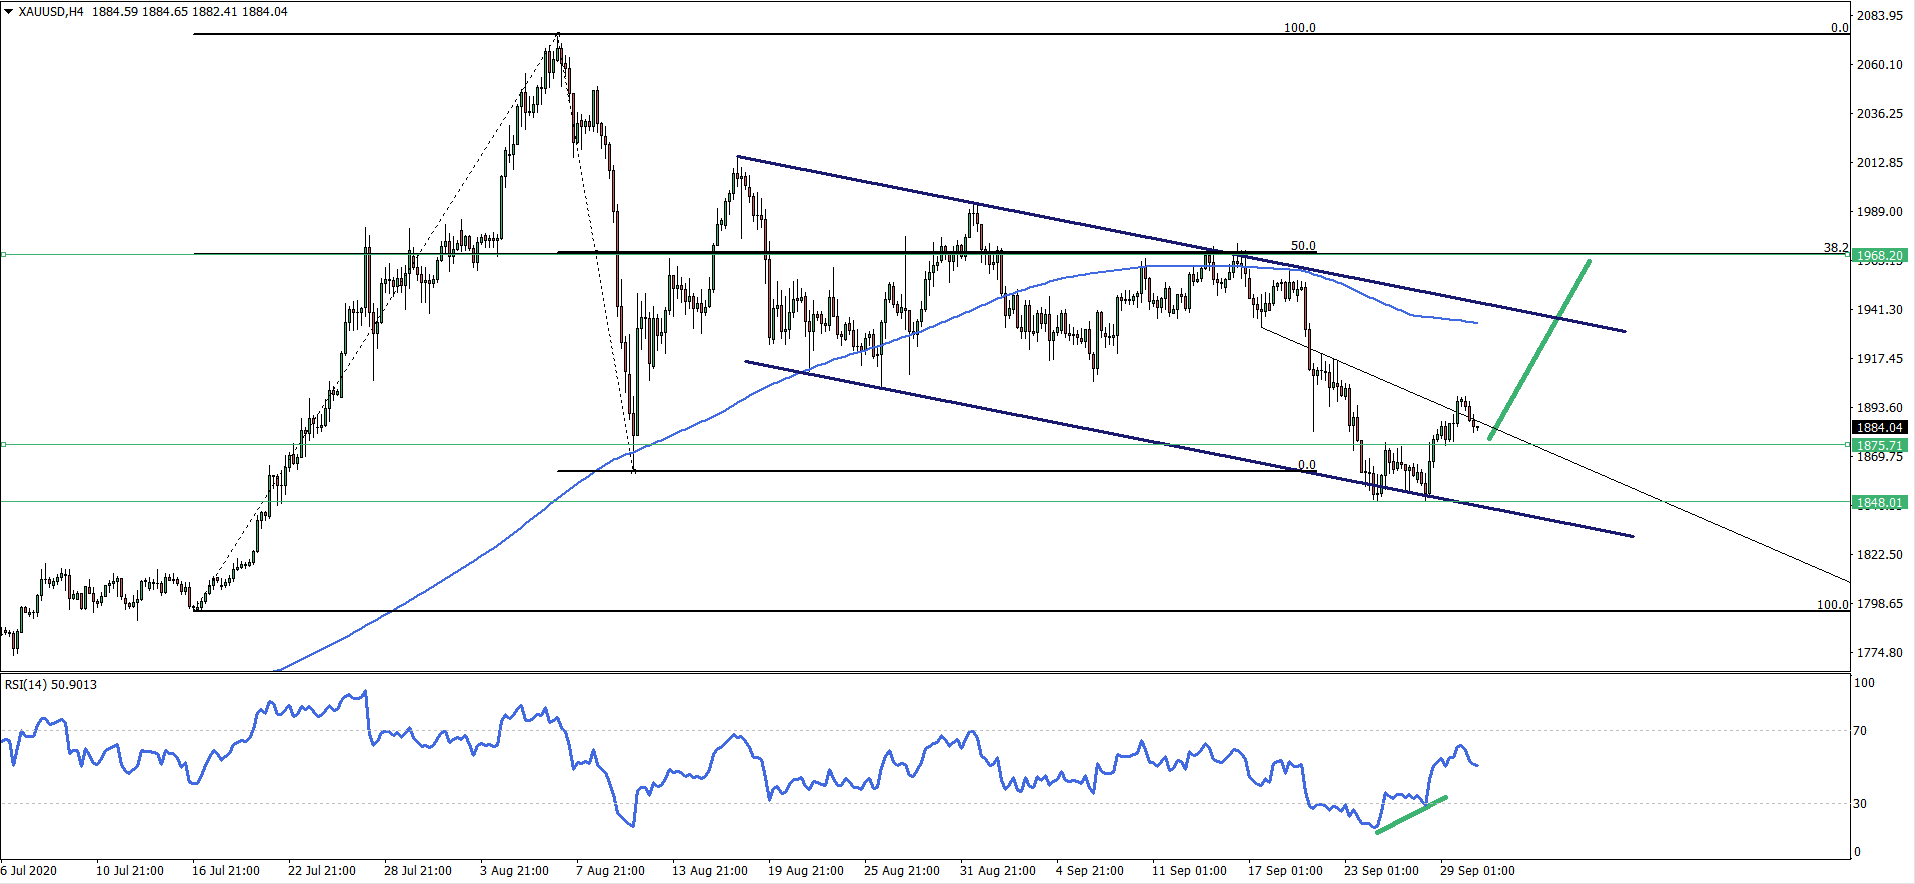
The long-term trend for Gold remains extremely bullish especially considering a strong ongoing devaluation of the US Dollar… Analysis Details: XAU/USD symbol on the MT4 platform Type: Bullish Key support levels: 1875, 1848 Key resistance levels: 1900, 1968 The 200 Simple Moving Average has been rejected back on August 12, when the price tested […]
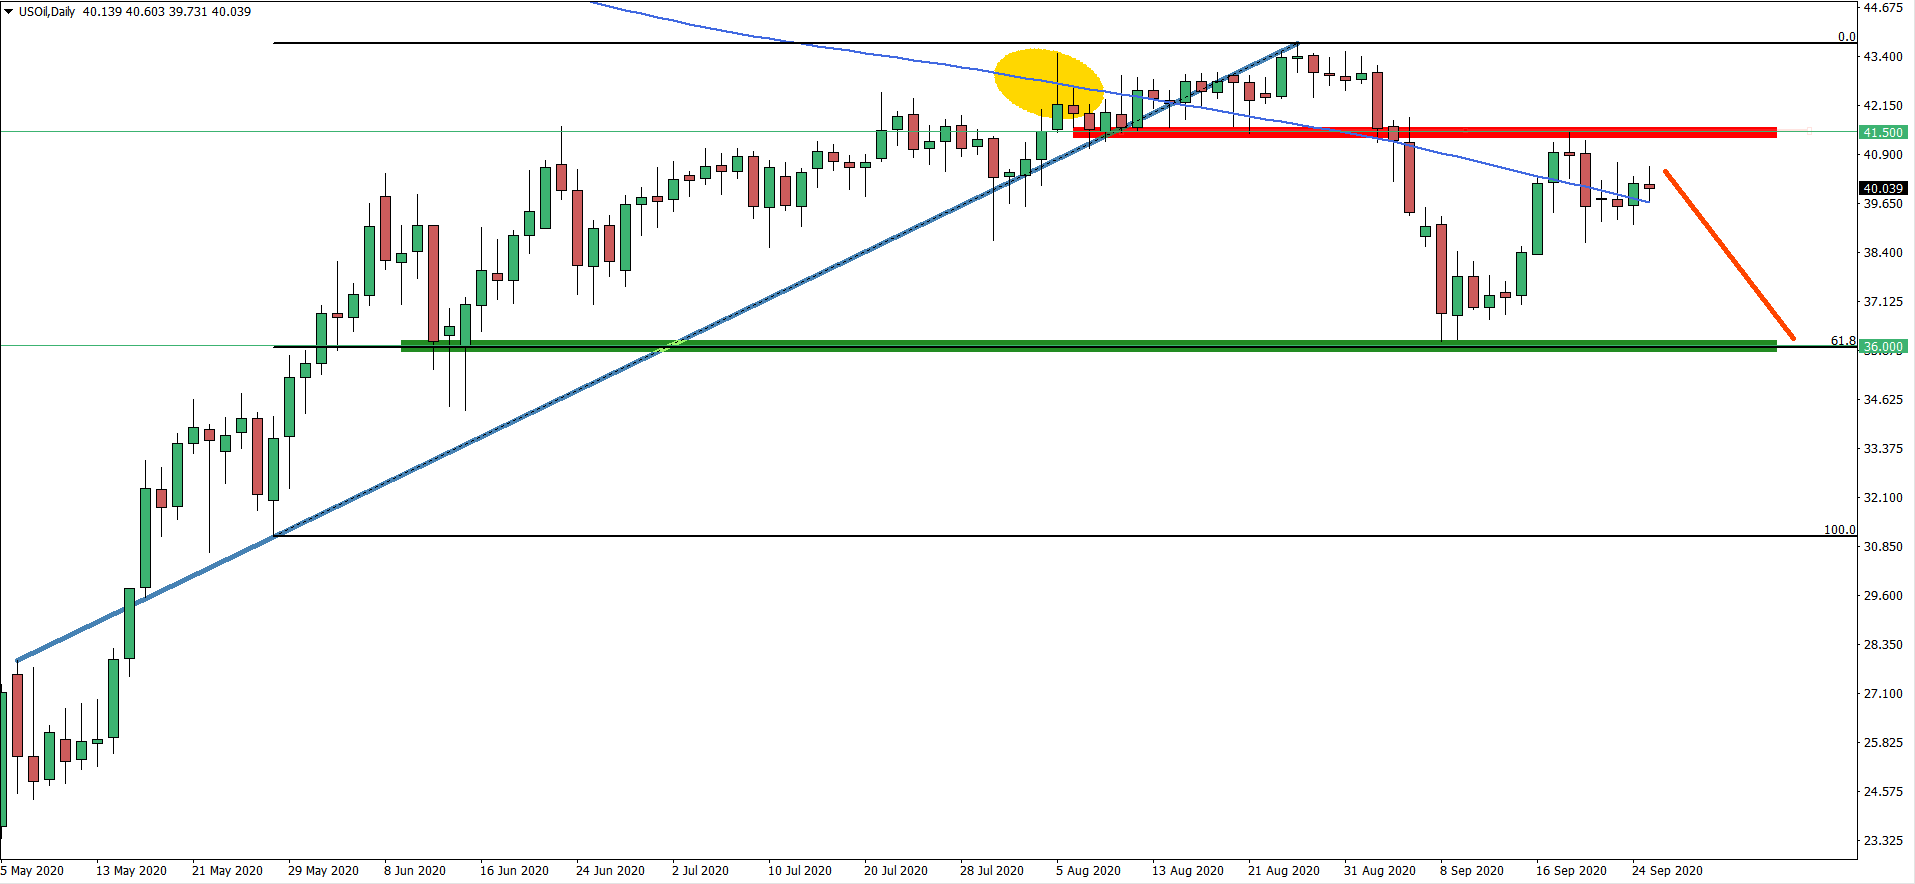
Starting with a daily chart it can be seen that USOIL rejected the 200 Simple Moving Average, confirming the validity of a long-term downtrend… Analysis Details: USOIL symbol on the MT4 platform Type: Bearish Key support levels: 36.00 Key resistance levels: 41.50 After price topped out on the August 26 and hitting 43.77 high, […]
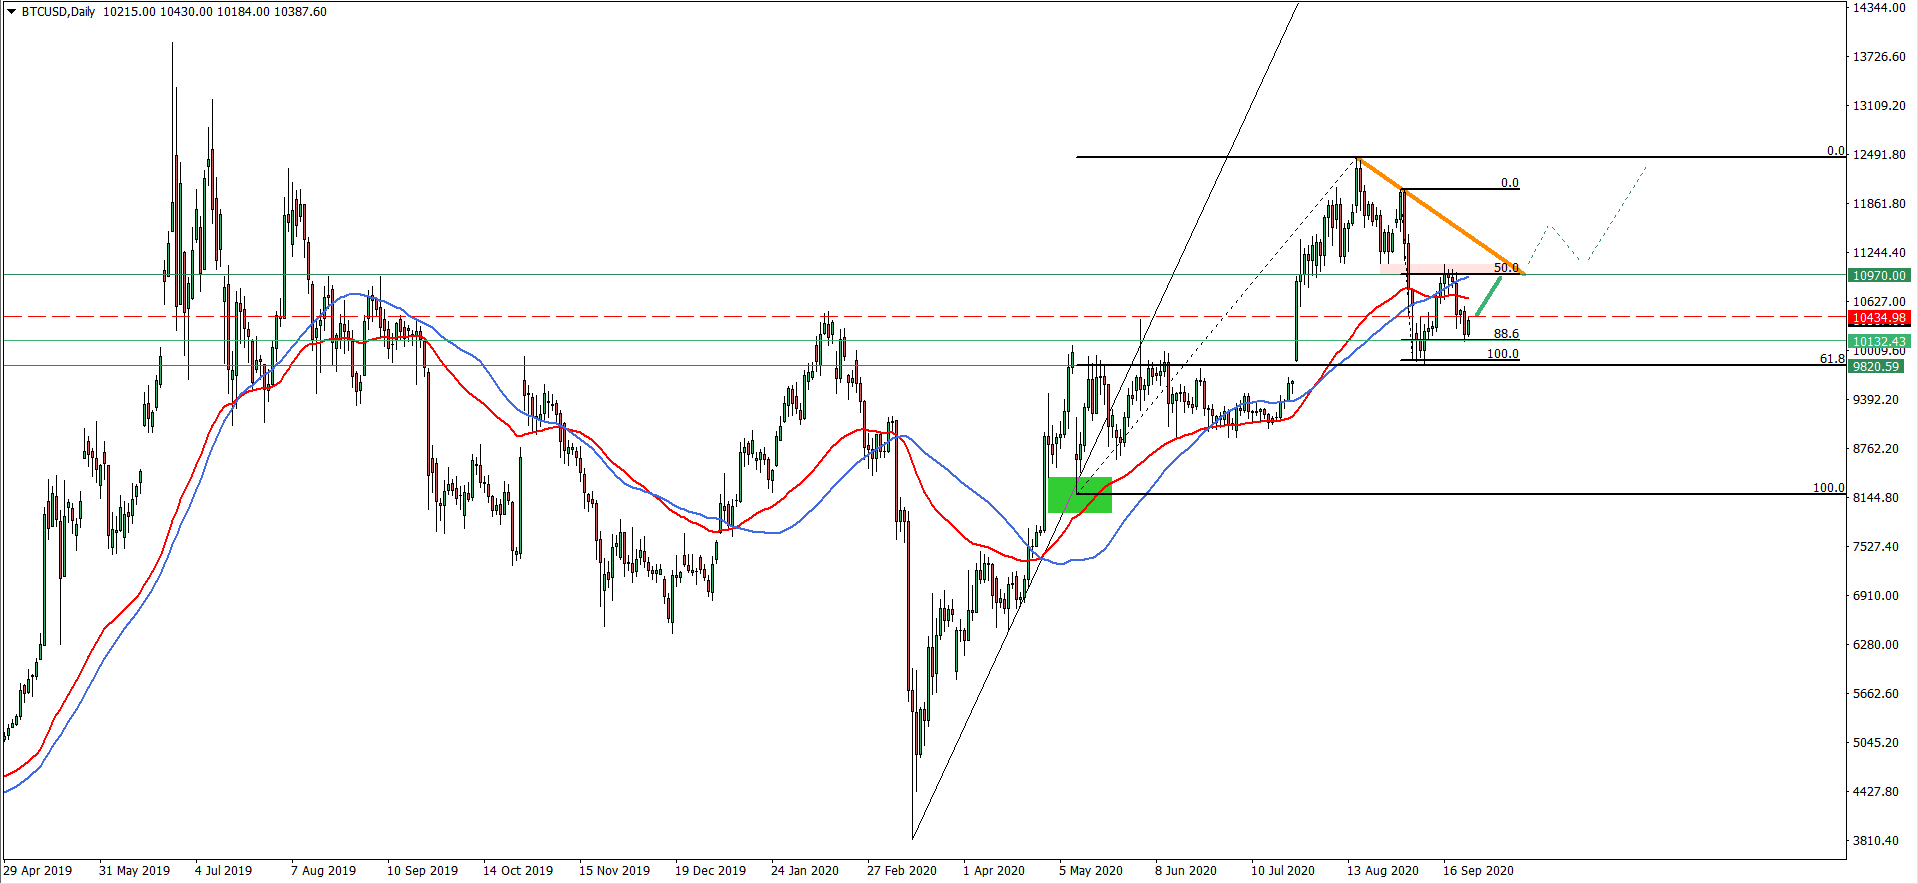
The Bitcoin long term trend is clearly bullish as the price continues to produce higher highs and higher lows… Disclaimer: The analysis presented in this article is for educational purposes only and should not be considered as financial advice. This analysis was done on MetaTrader 4. Click below to open a Free Demo Account […]
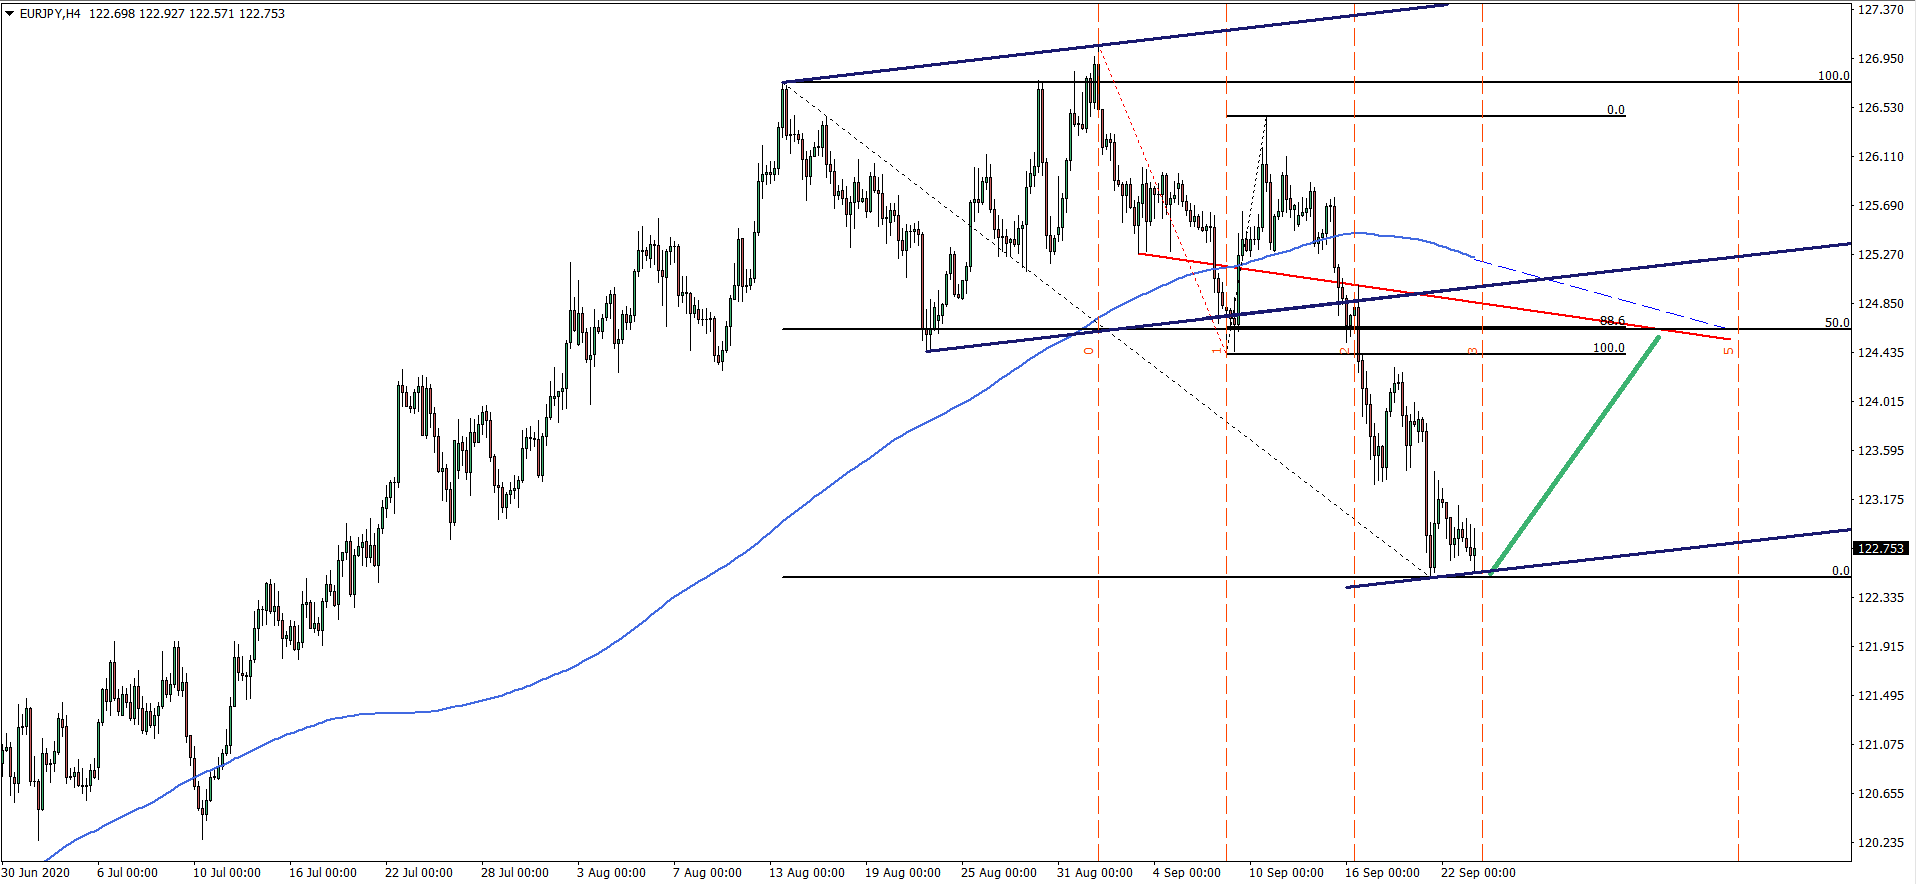
As long as daily closing prices remain above the 122.50 support, correctional move to the upside should be expected. Disclaimer: The analysis presented in this article is for educational purposes only and should not be considered as financial advice. This analysis was done on MetaTrader 4. Click below to open a Free Demo Account […]
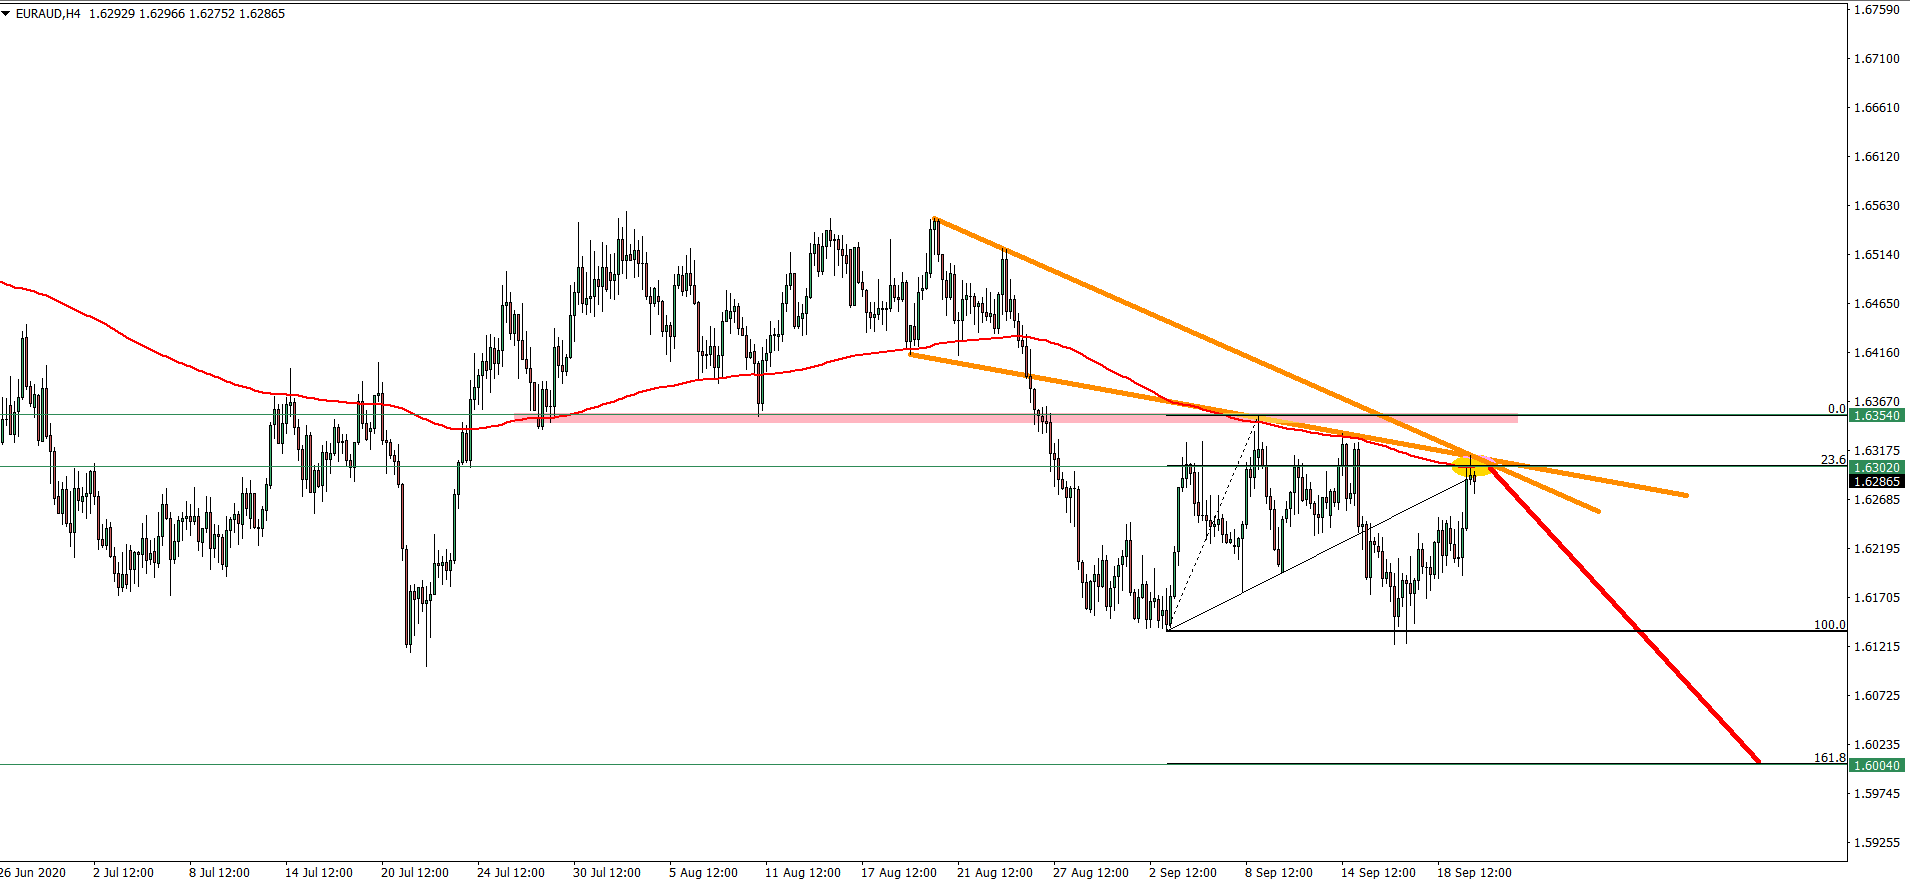
The EUR/AUD major trend remains bearish as the price continues to produce lower lows and lower highs. Besides, today’s price has reached and rejected 4 resistance indicators simultaneously. Disclaimer: The analysis presented in this article is for educational purposes only and should not be considered as financial advice. This analysis was done on MetaTrader […]
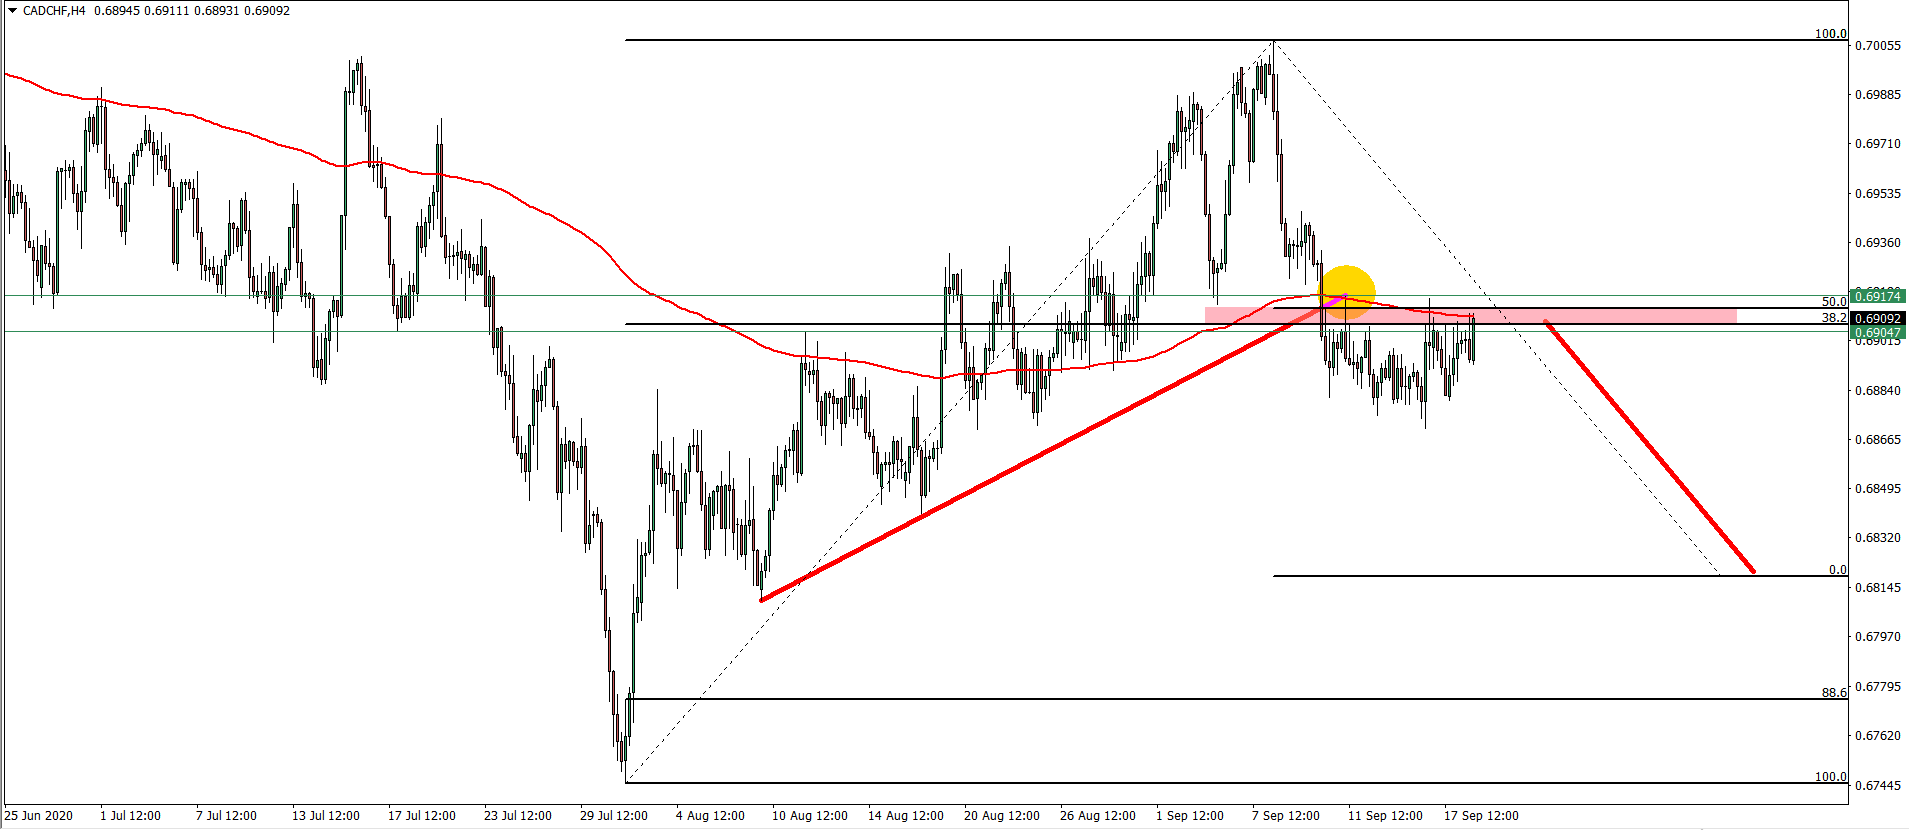
On September 10th, the CAD/CHF broke and closed below the uptrend trendline as well as the 200 Exponential Moving Average. On the pullback up, the uptrend trendline and the 200 EMA were both rejected cleanly, strongly suggesting bearish domination. Disclaimer: The analysis presented in this article is for educational purposes only and should not […]
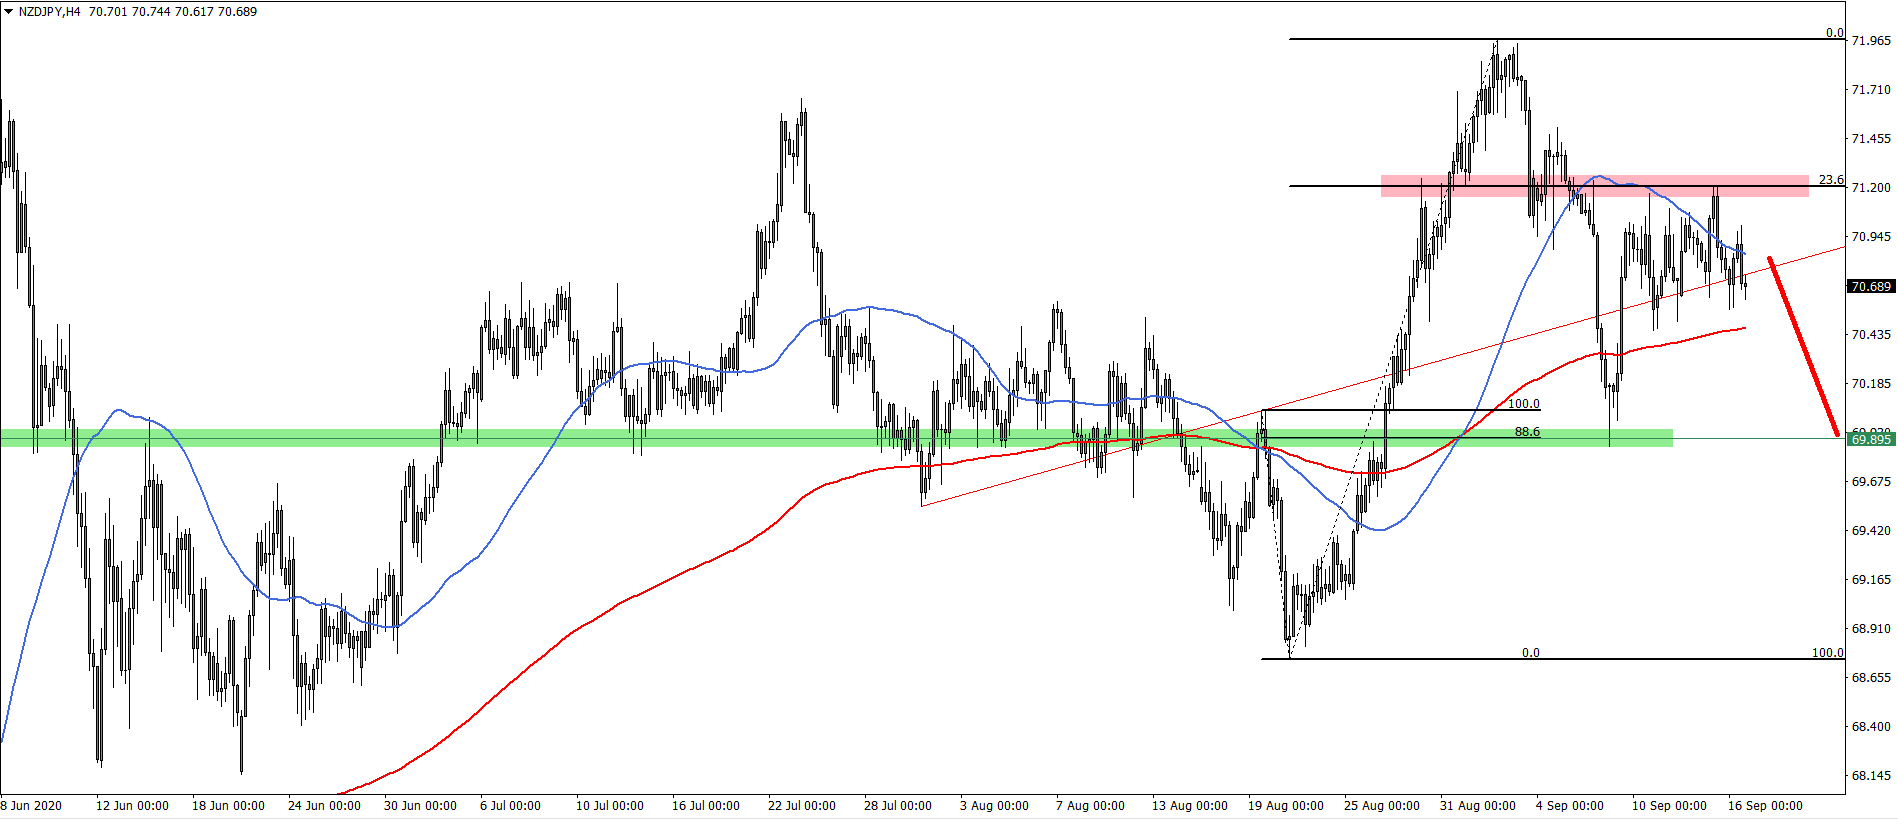
NZD/JPY started to produce lower lows and lower highs, suggesting the validity of the downtrend. Besides, price broke below the average price uptrend trendline as well as 50 Simple and 200 Exponential Moving Average. Disclaimer: The analysis presented in this article is for educational purposes only and should not be considered as financial advice. […]
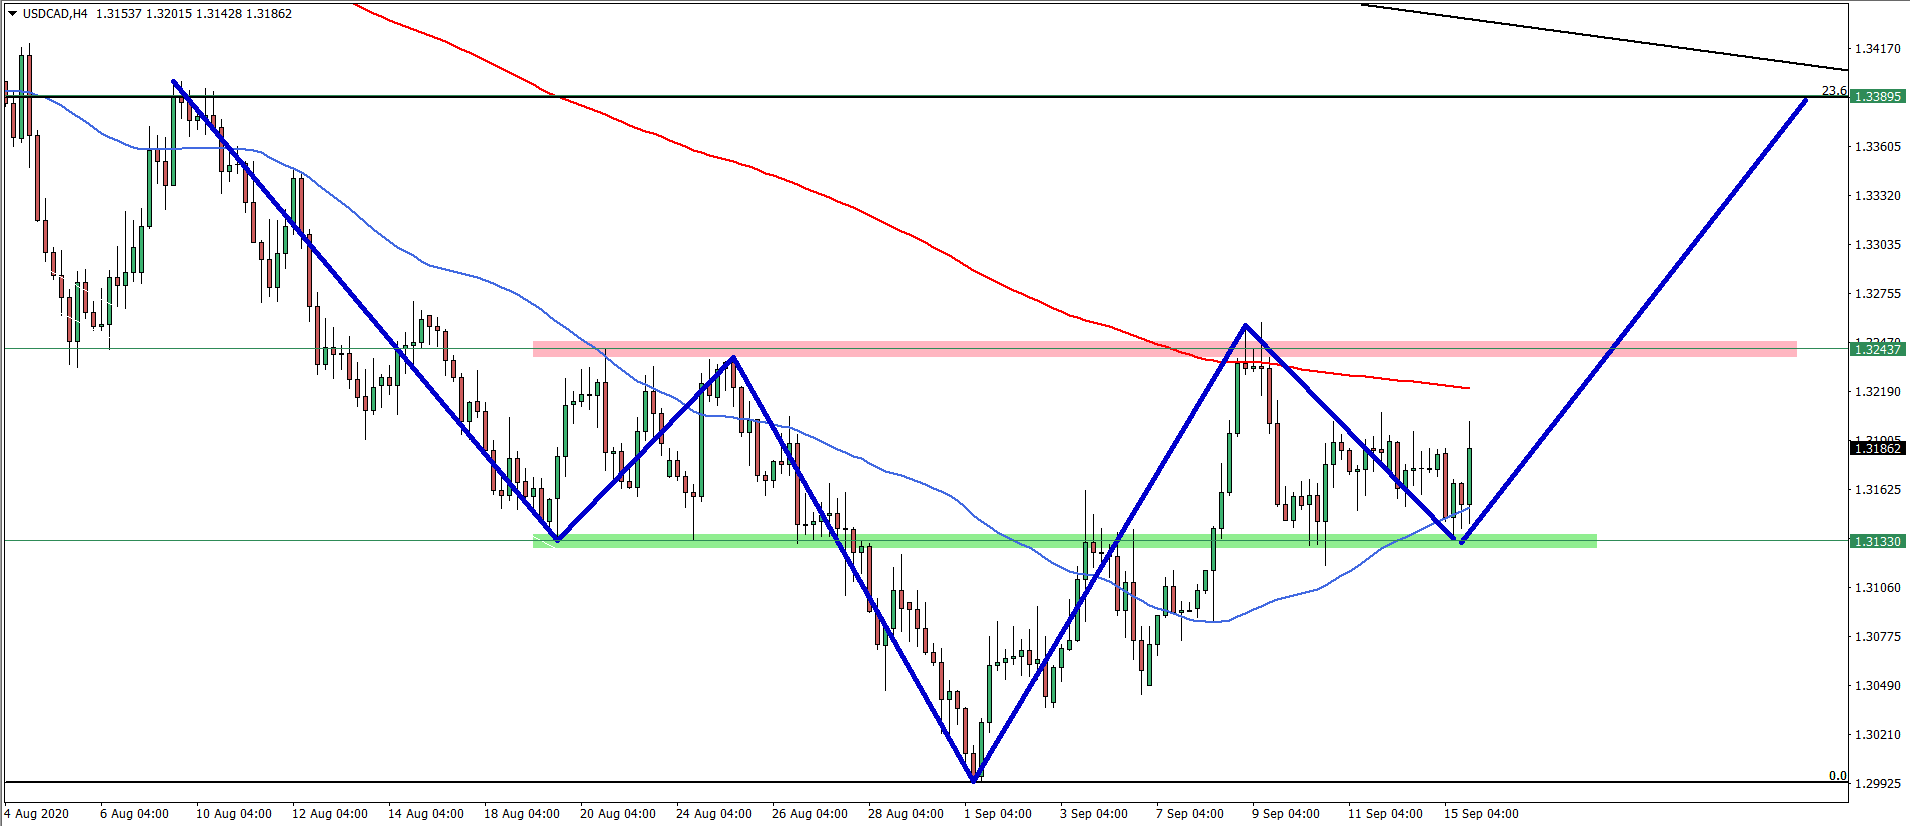
On the daily chart, the price has reached and rejected the key psychological price area near 1.3000, after which it went up and broke above the downtrend trendline. Such price action suggests further upside correctional move which might result in the price rising towards one of the Fibonacci resistance levels. Disclaimer: The analysis presented […]
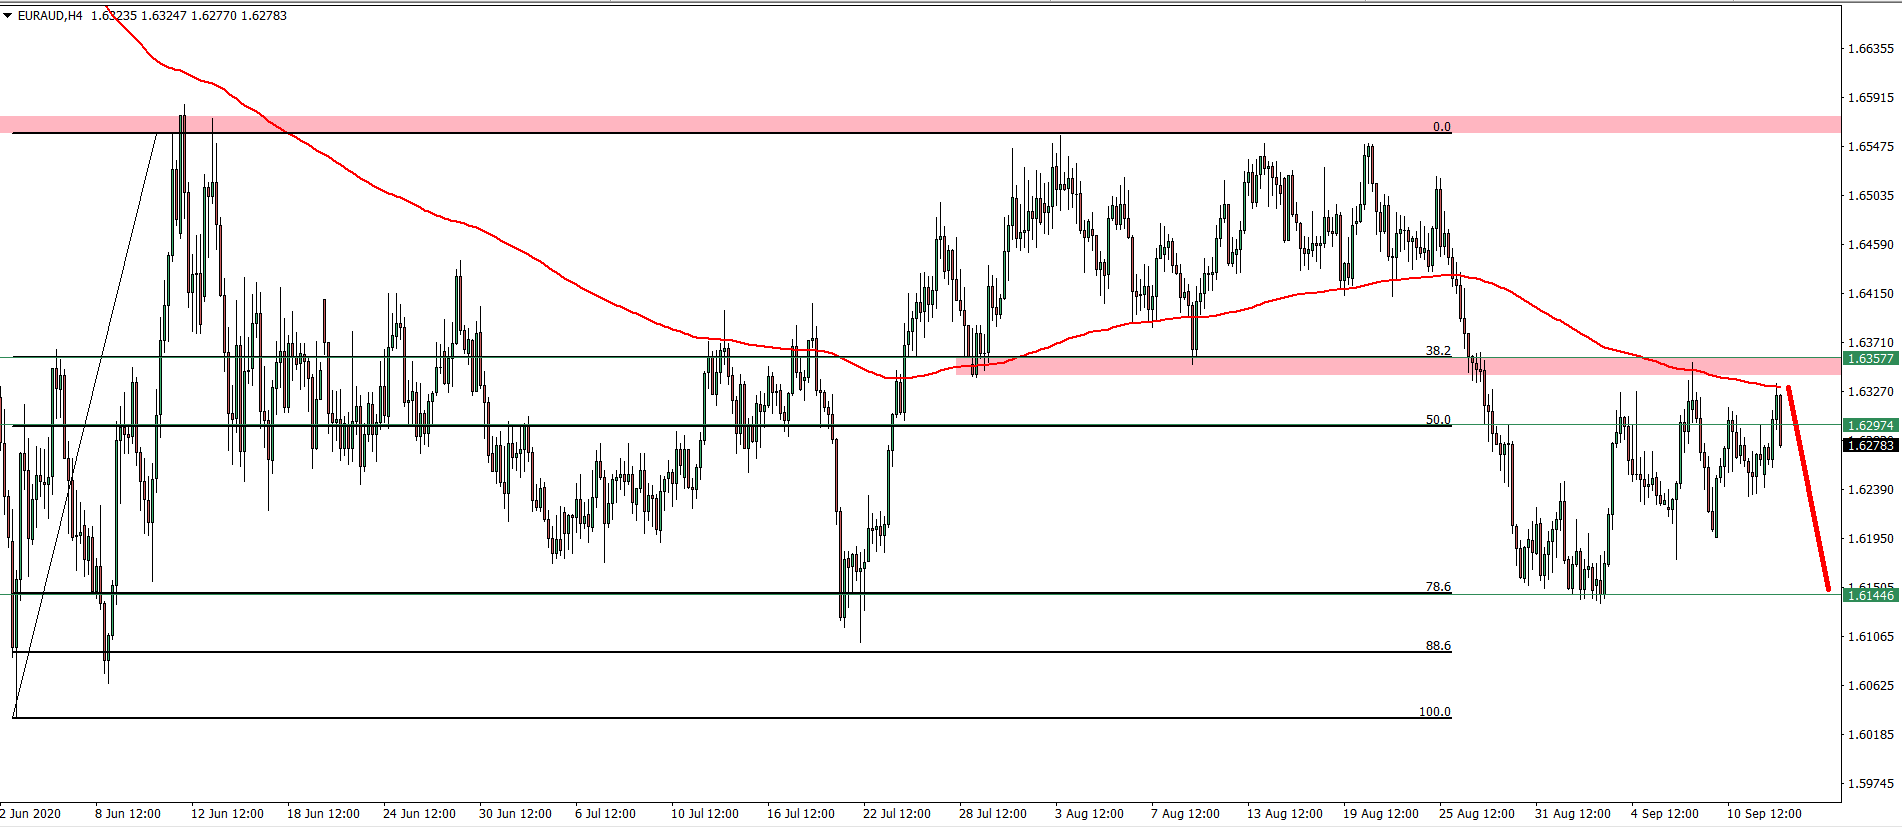
The EUR/AUD 4-hour chart shows a clear consolidation phase which has started back in June this year. Since then price failed to break above the key resistance located near the 1.6560 area, which has already been rejected twice. Disclaimer: The analysis presented in this article is for educational purposes only and should not be […]