Every trader around the world heard of the Relative Strength Index, also known as the rsi technical indicator. No matter if trend followers or reversal’s hunters, traders use the Forex rsi oscillator for market entry/exit.
Technological advances forced both brokers and retail traders to “step up” to the game. Back in time, technical analysis was made of printing a chart, drawing some lines, and placing the entries. Not anymore.
Trading in general and Forex trading, in particular, changed dramatically. Computers took over our lives. Like it or not, traders don’t have an excuse they missed a trade. After all, everyone has a smartphone, right?
These technological advances allowed brokers to offer better and better trading conditions. Moreover, they improved the offering on their trading platforms. Tough competition leads to dramatic changes.
Any trading platform comes with default Forex indicators, but traders do not limit to those. Yet, some of the best ones come with the default settings. The rsi mt4 indicator is one of them.
Make no mistake, not only the MetaTrader 4 offers it. All trading platforms around the world, from the most simplistic to the most advanced ones, do. So important is the rsi indicator for day trading, that there’s no comparison with other indicators retail traders use.
Two main indicators categories dominate technical analysis: trend indicators and oscillators. Riding the trend is every trader’s dream. However, the problem is that the Forex market doesn’t trend that much.
But what to do when trends reverse? Or, when ranges occur? The answer is to use an oscillator. There’s no oscillator more accurate than the technical indicator rsi.
Judging by the paragraph above, you already know the rsi Forex indicator is an oscillator. Because of that, traders use it to spot fake moves the price might make.
How to Use the Forex RSI Indicator
As mentioned above, the main task of an oscillator is to show fake moves. For this reason, one of the favorite ways to use the rsi for day trading and not only is to look for divergences. Therefore, if the rsi technical indicator and the price move in an uncorrelated manner, chances are the price makes a fake move.
However, this is not the only way to use this wonderful indicator. The aim of this article is to show multiple ways to use it. Moreover, to highlight its potential as well as its limitations.
Believe it or not, the Forex rsi indicator is enough for profitable trading. There’s a saying that the more indicators one uses, the less profitable he/she is. This is so true!
As traders, we have to think of the following: the market represents the price of an underlying security. EVERYTHING we use, we use to form an idea about its direction.
Any input, analysis, trend indicator, oscillator, news, rumor, etc….is just that: a tool to forecast the price. The more you use, the more you lose focus on what really matters: the price!
The rsi technical indicator offers a great way to have an idea what the price does right now. If anything, the oscillator is more accurate about price. Yet, retail traders have a hard time grasping its importance.
Before looking at ways to trade with is, we have to know what is rsi in Forex and its calculation. After all, traders need to know what they based the trading decision on.
Understanding the RSI Technical Indicator
The father of the rsi indicator formula is the now famous J. Welles Wilder. You may never heard of him, but as a trader, you certainly used his indicators.
Besides the Forex rsi indicator, Wilder takes credit for other indicators too. The Average True Range, Average Directional Index, and the Parabolic RSI – all are his creation.
However, the rsi indicator Forex traders use is the most popular one. Its formula is quite simple:
RSI = 100 – 100 / (1 + RS)
The RS stands for the average gain of up periods in a timeframe, divided by the average loss of down periods in the same timeframe. Sounds complicated? Maybe a bit.
Think of this indicator’s name: relative strength. That means the indicator considers averages.
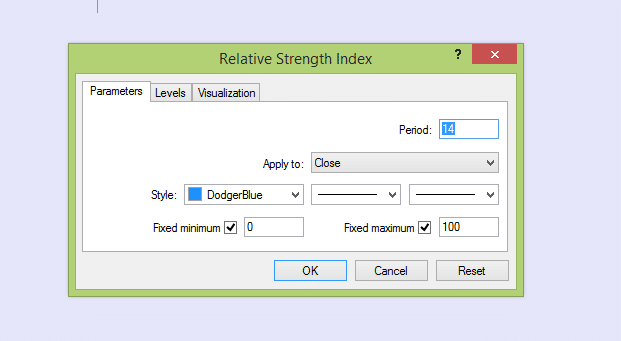
By default, the Forex rsi settings consider fourteen (14) periods. As such, the oscillator plots the values based on the average gain and loss in the last fourteen candles.
This makes the time frame used extremely important. On a monthly chart, the rsi technical indicator will consider fourteen months. And so on.
However, the period is not fixed. Traders may use custom values to plot the indicator in different ways.
The rsi indicator settings allow it to travel only in positive territory. That is, from 0 to 100. In other words, it’s impossible to have a negative print. Or, one higher than 100.
As a rule of thumb, the bigger the number of periods used, the more the indicator will swing between lower and higher values. The smaller the period is, the flatter the indicator becomes.
The 14 period is the one period that best reflects this indicator’s capabilities. Moreover, if this is the way Wilder wanted to use it, it must be a good reason for that.
Trading Overbought and Oversold Levels with RSI Indicator
Now that we know what is the Forex rsi indicator, let’s look at how to use rsi indicator in Forex trading. Buying in an oversold and overbought territory is one way to trade with it.
The Forex rsi settings for this indicator show the 30 and 70 levels as key. Therefore, traders closely watch the oscillator to reach these values.
The standard interpretation is that any print above 70 gives a selling opportunity. As such, this is an overbought area. What to do in an overbought area? Of course, sell some.
On the other hand, the 30 is the oversold level. If a currency pair has the ability to act so bearish that the rsi technical indicator alert drops below 30, traders will buy the pair.
Because of this simple statement, many traders go bust. Forex trading is not that easy, you know? If it was supposed to be that easy, every retail trader will make money. You should know by now that is not correct.
This is why education is important. Like in any job, to succeed, you need to prepare first.
The thing is that trading rsi overbought and rsi oversold levels works almost like clockwork. However, there’s a catch. This is true only if the market is in a range.
Fortunately, most of the time, the market is ranging. But traders do not know when the range ends. Because of that, they end up on the wrong side of the market when the range ends and a new trend starts.
Guess what will happen in this situation? Yes, the stop loss gets triggered. Or, worse, traders will get a margin call.
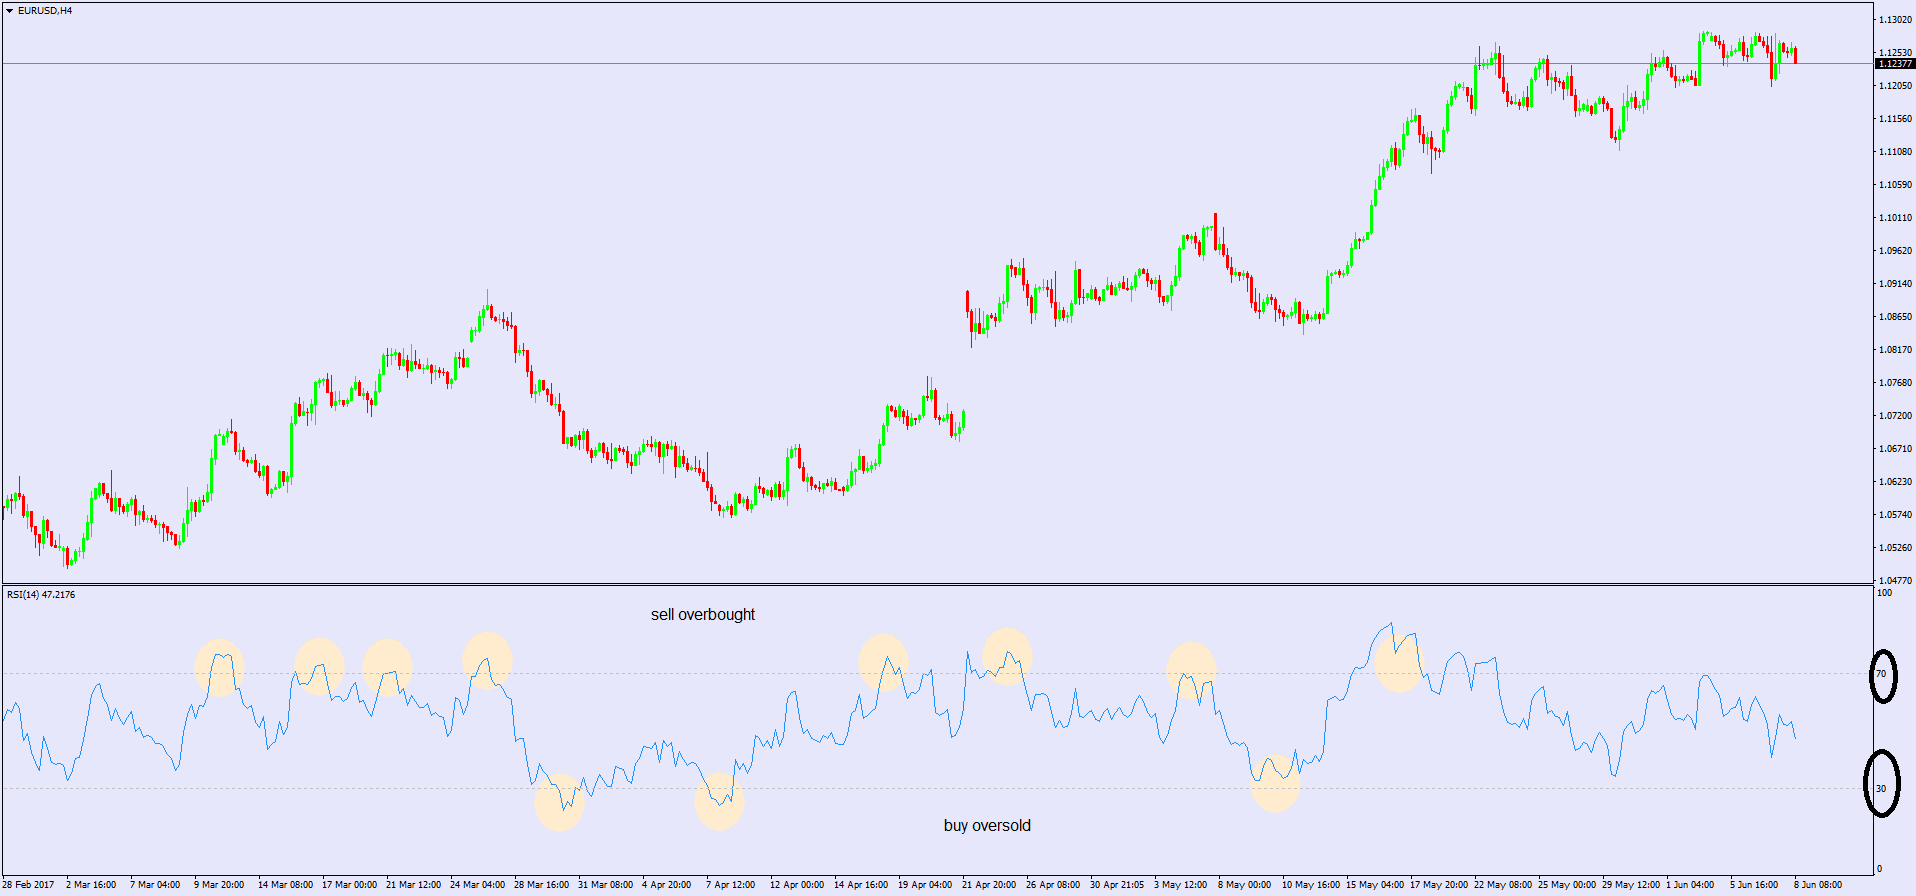
Imagine you sold on the first overbought level on the left side of the chart above. Not a wise decision, right?
How to Make the Most of RSI Indicator Buy and Sell Signals
Because overbought and oversold levels end up being tricky, it doesn’t mean they have no value. The key is to KNOW WHEN to use them.
If they work best when a currency pair is in a range then that’s what traders need to do. For this, you must know how to identify a range.
Here are some tricks on how to use the Forex rsi indicator for day trading with overbought and oversold levels:
- Trade crosses rather than majors. Any currency pair that doesn’t have the U.S. dollar in its componence is a cross. Use the ATR (Average True Range) indicator and select the ones that have the lowest range.
- Look for important economic news. Take this week, for example (June 5-9, 2017). The ECB (European Central Bank) press conference and interest rate decision looms Thursday. Because of that, chances are that traders will wait until Thursday before committing to a new direction. Hence, the EURUSD will range, most likely, until the event comes.
To make the most out of this, you should go on the lower timeframes to trade the possible range, right? Excellent, let’s do that!
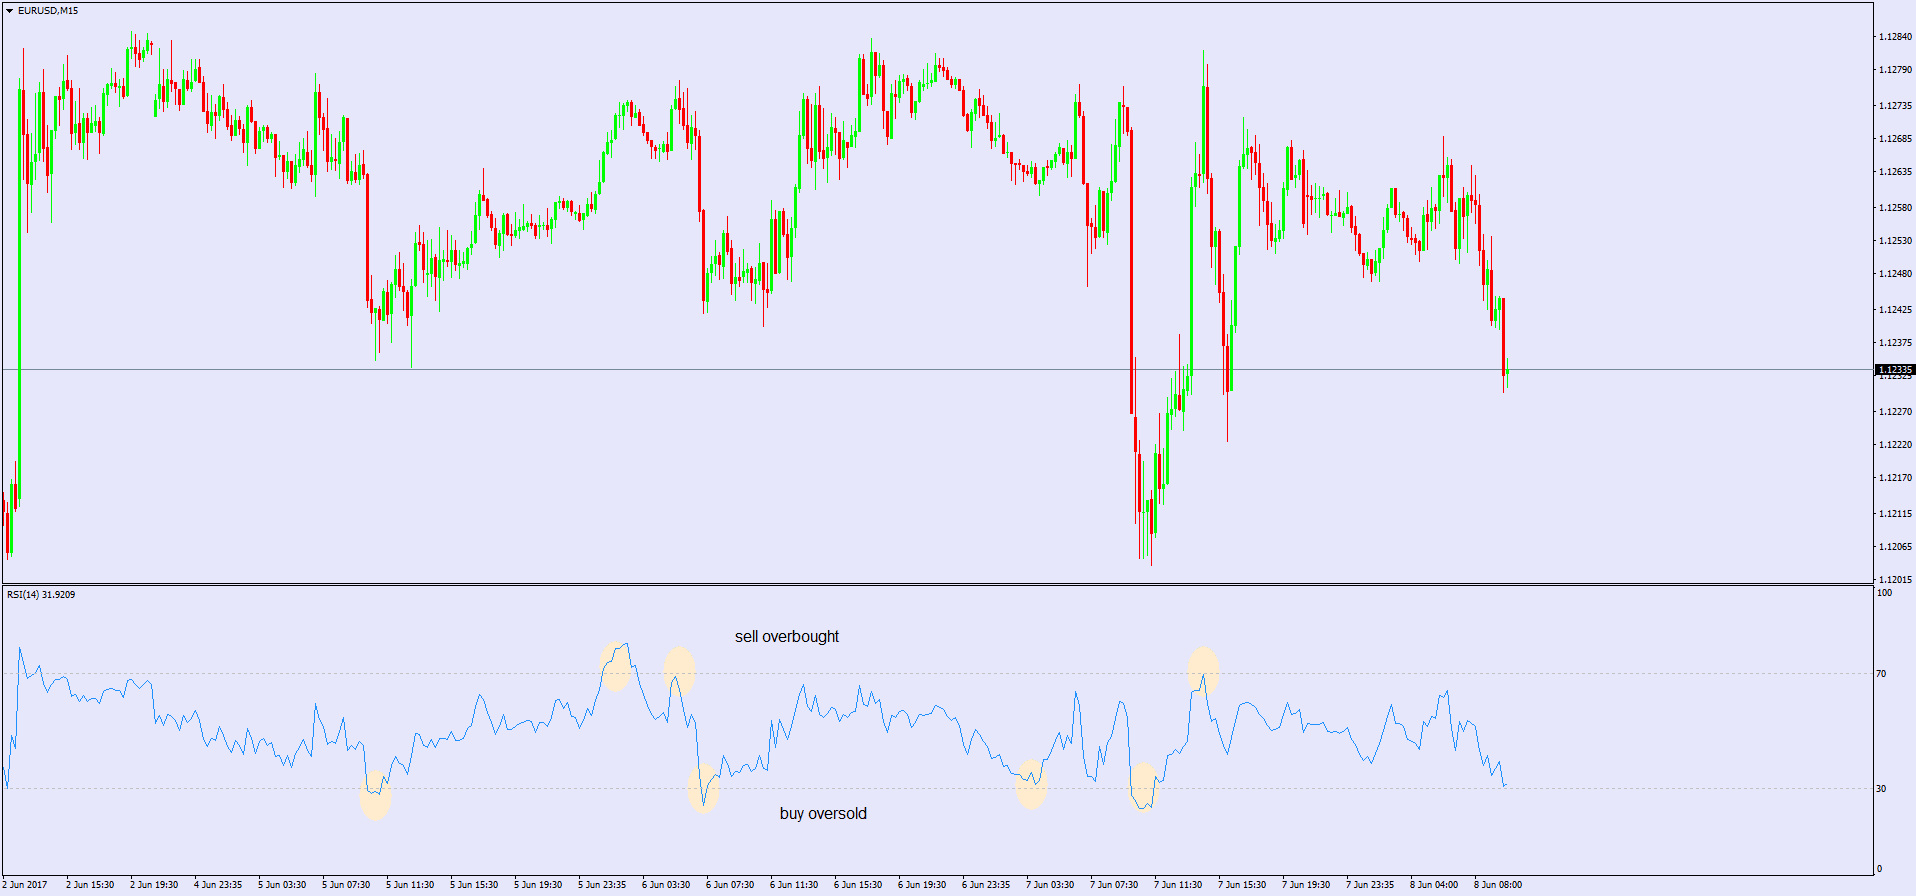
Above is the EURUSD fifteen-minute chart for the current ECB week. It shows how the pair moved starting with Monday’s opening until Thursday before the ECB interest rate decision.
Is this the best rsi Forex trading strategy, or what? Buying oversold and selling overbought levels worked like a charm! This simple approach gave no less than seven great trades in one single week.
Actually, in less than a week. In only four trading days, the rsi indicator calculation gives perfect buy and sell signals. What was the secret? You know by now: identify a range.
How to Trade an RSI Divergence
The previous example showed how great this oscillator is. Like any other tool the rsi technical indicator offers traders an educated guess about the future direction.
But trading with the rsi indicator mt4 platforms, and not only, offer, is more than that. How about trying to pick a top or a bottom in a trend?
Traders are either conservative or aggressive. This has very much to do with the type of a person one is. Are you patient? If that’s the case, you’ll swing-trade or invest, not scalp.
For aggressive traders, picking a top or bottom is the bread and butter of everyday trading. In a way, it makes sense.
A top or a bottom, if spotted properly, gives a better entry. And, as a result, a better risk-reward ratio.
If traders wait until the new trend starts, they may end up getting in the trend too late. Remember that the Forex market spends most of the time in a range, right?
Traders wondering what is the rsi technical indicator and why traders use it, have their answer: it’s a great tool to spot divergences. Furthermore, to trade reversals. Or, to get into a trade earlier than other traders, for a bigger profit.
A divergence forms when the price and the rsi divergence indicator move in different directions. Or, to be more exact, the rsi technical indicator doesn’t confirm the move the price makes.
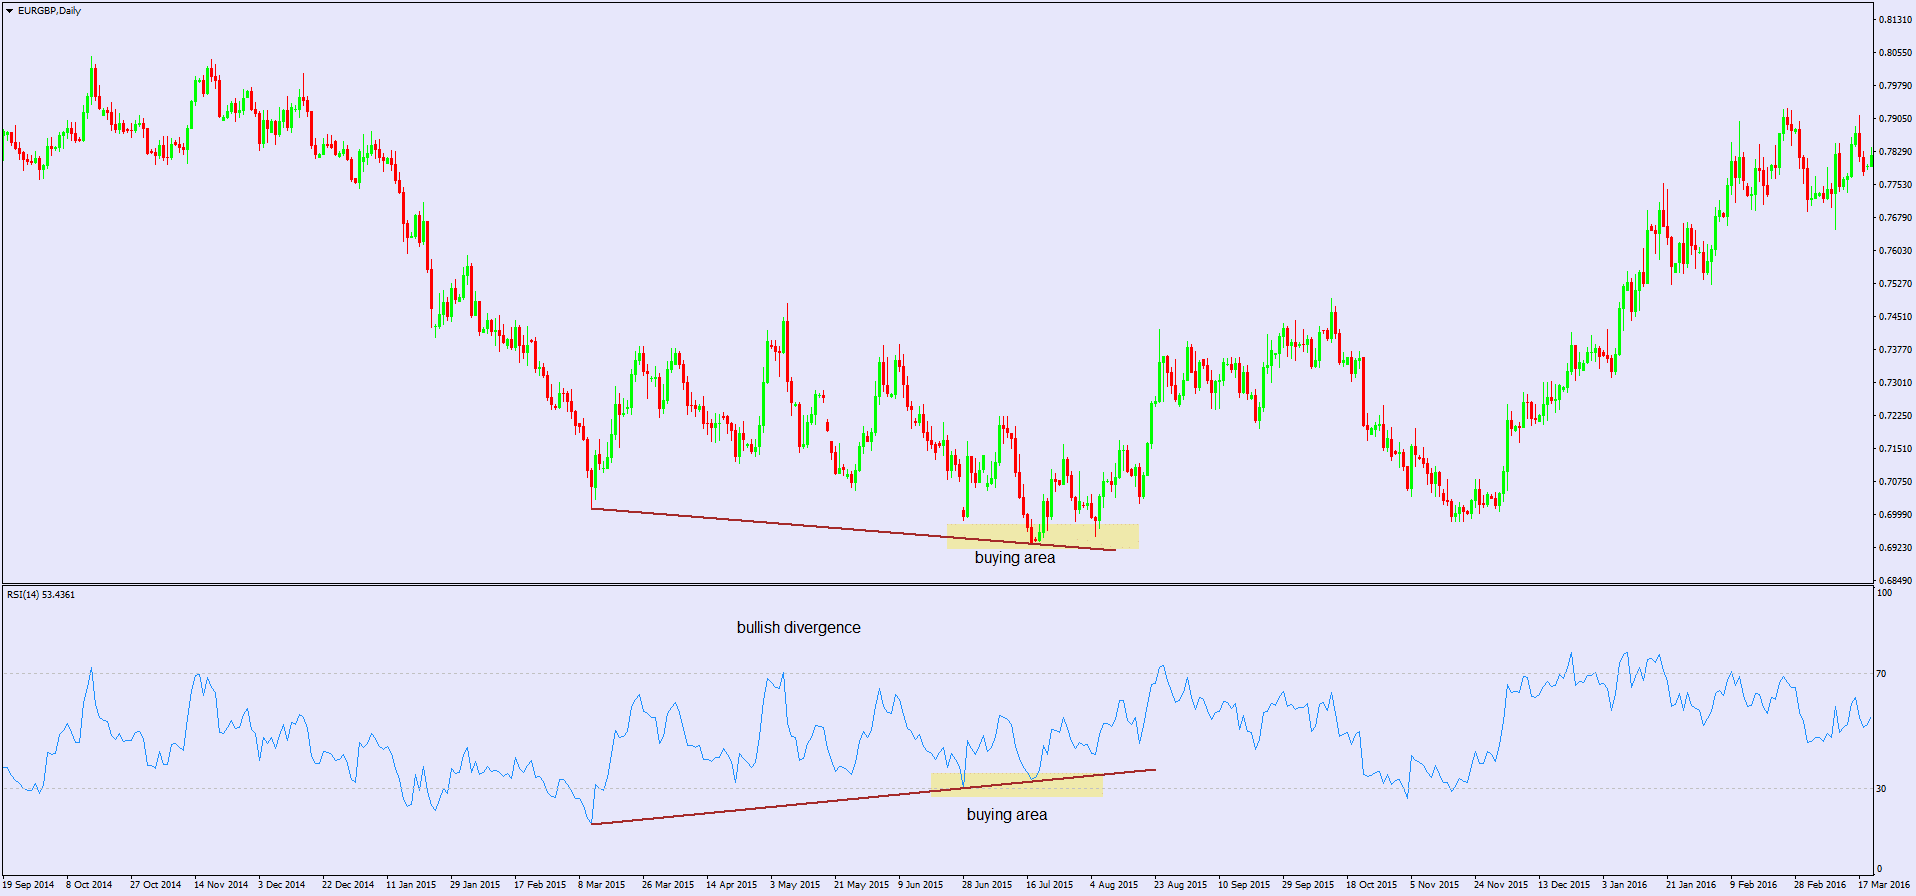
Above is the EURGBP daily chart. This is quite a big timeframe. As a rule of thumb, whenever you apply an indicator on a chart, the bigger the timeframe is, the bigger the implications.
A bullish divergence forms when the price makes two consecutive lows and the Forex rsi divergence indicator mt4 doesn’t. In other words, the indicator fails to confirm the second low.
RSI Divergence Live Trading Example
And now that you are familiar how to use the rsi divergence, I will give you a real example of it. The video below will show you a real trade taken based on a bearish rsi divergence between the price action and the indicator. The video will help you get the picture and the best is that I am giving it to you absolutely for FREE.
So, simply enter your details and watch carefully.
Notice that I was constantly relying on price action techniques to control my trade. The bearish channel gave me an additional confirmation that the price is likely to finish the bearish move and will probably seek an interaction with the upper level of the channel. This is why I decided that it is better to end the trade and to collect my profit.
Other RSI Forex Trading Strategy
This example above is bullish. Moreover, the bigger the time frame, the bigger the implications. In the EURGBP example above, the bullish divergence marks the start of a bullish trend.
However, while divergences offer great risk reward ratios, trading them is risky business. A conservative approach would be to use the Forex rsi divergence indicator as a continuation pattern.
To achieve that, we need to split the range into two equal parts. From the minimum value (zero) to the maximum one (a hundred), the fifty is the middle range.
To edit the rsi indicator mt4 platforms offer, simply right-click anywhere on the chart and select the Indicators List. From there, select the Relative Strength Index and go to the Edit tab.
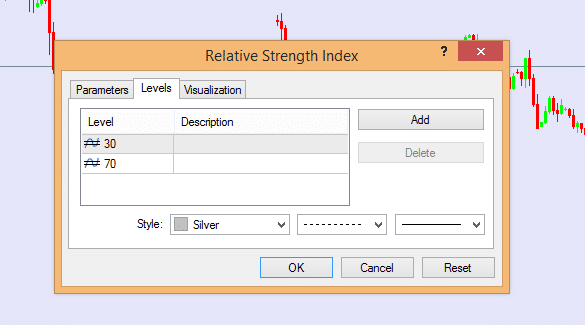
The right top corner of the image above shows the Add button. That is how you add a level to your rsi technical indicator.
The idea behind this strategy is to buy or sell when the oscillator crosses the fifty level. As such, a bullish trade would appear when the rsi travels from below 30 and crosses the 50.
On the other hand, a bearish trade appears when the Forex rsi comes down from above 70 to below 30. The bigger the time frame, the better the trade setup is.
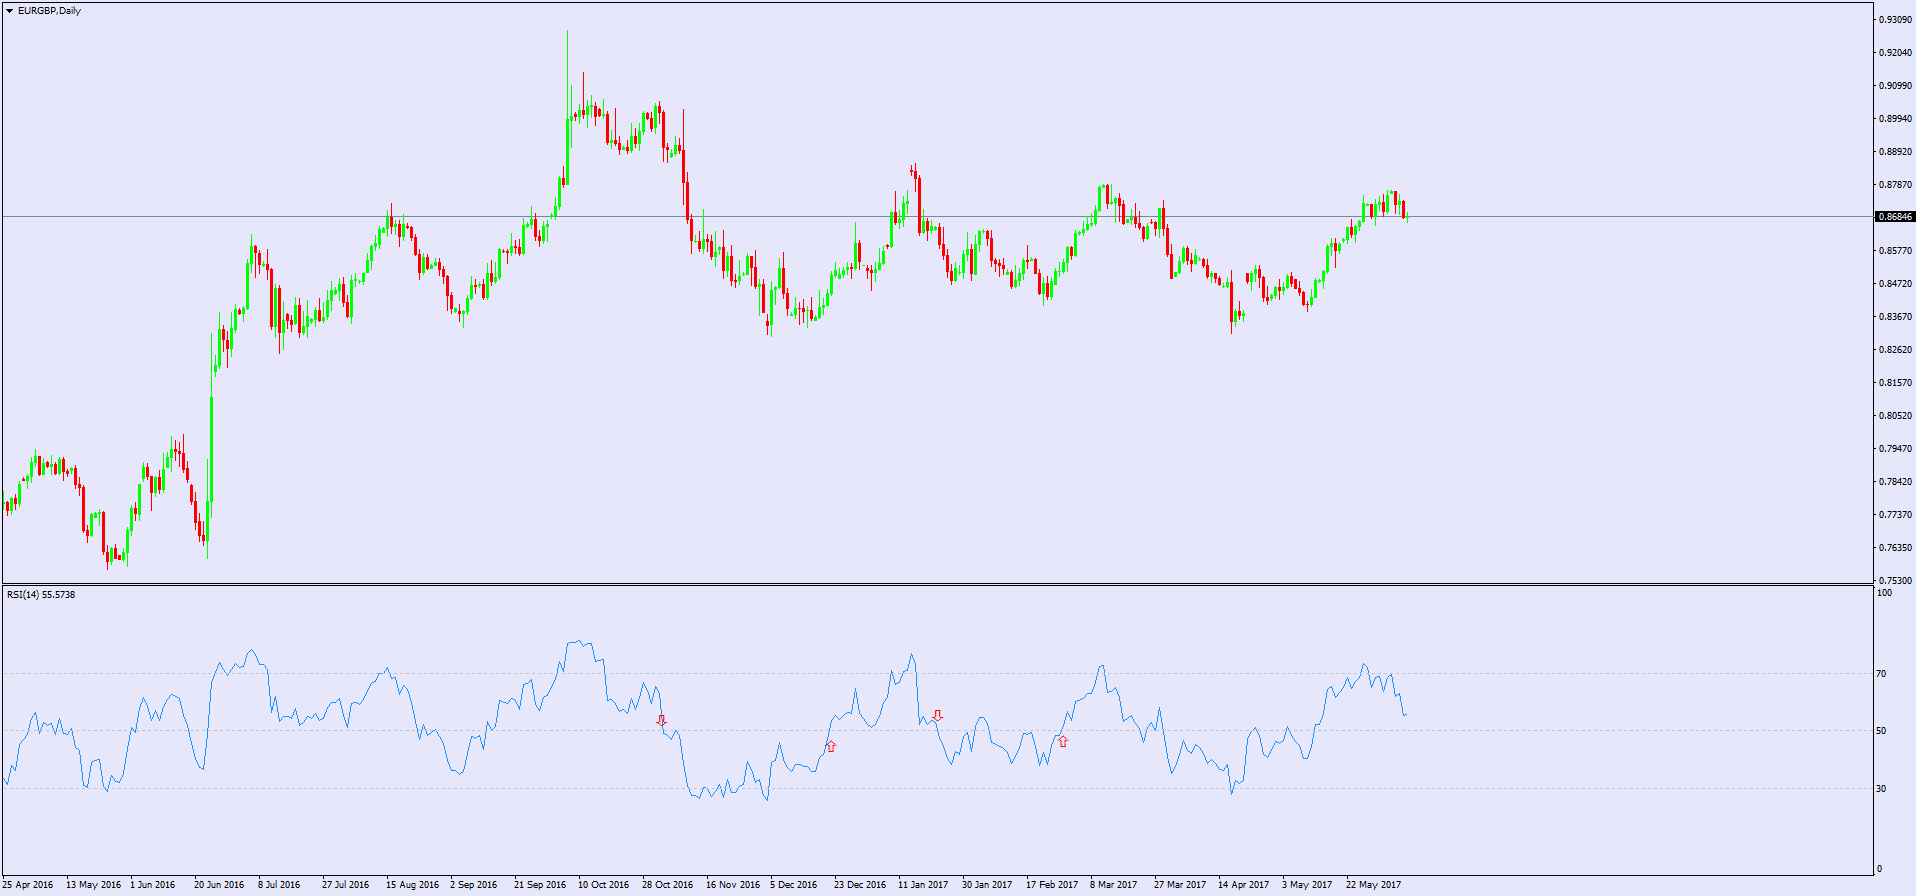
Take this daily EURGBP example from above. As you can see, the 50 level appears on the indicator windows.
The next thing to do is to wait check for a value above 70 or below 30. When it comes, wait for the rsi to move below or above 50. Moreover, stay on the trade until 30 or 70 comes again.
Positive and Negative Reversals with the RSI
Few people are aware of positive and negative reversals. In fact, most of the retail traders don’t even know they exist. What a shame!
You see, it is no wonder they go under the radar so much. As a trader, you have to be open minded to look for them.
In a way, they resemble divergences. However, that Forex rsi trading strategy looks for the price to make two higher highs or lower lows and the indicator to show different. That’s a classical divergence.
A positive or negative reversal has the same interpretation. However, as always, there’s the catch. Whereas a divergence forms in the overbought and oversold territory, a reversal forms when the rsi is NOT overbought and oversold.
Let’s have an example using the same daily EURGBP timeframe. As you can see below, while the rsi technical indicator explained a low-volatile price action in the middle of the range, a positive reversal forms.
This is a bullish sign, despite the actual price falling. Because the rsi technical indicator doesn’t confirm that fall in price, buyers will step in.
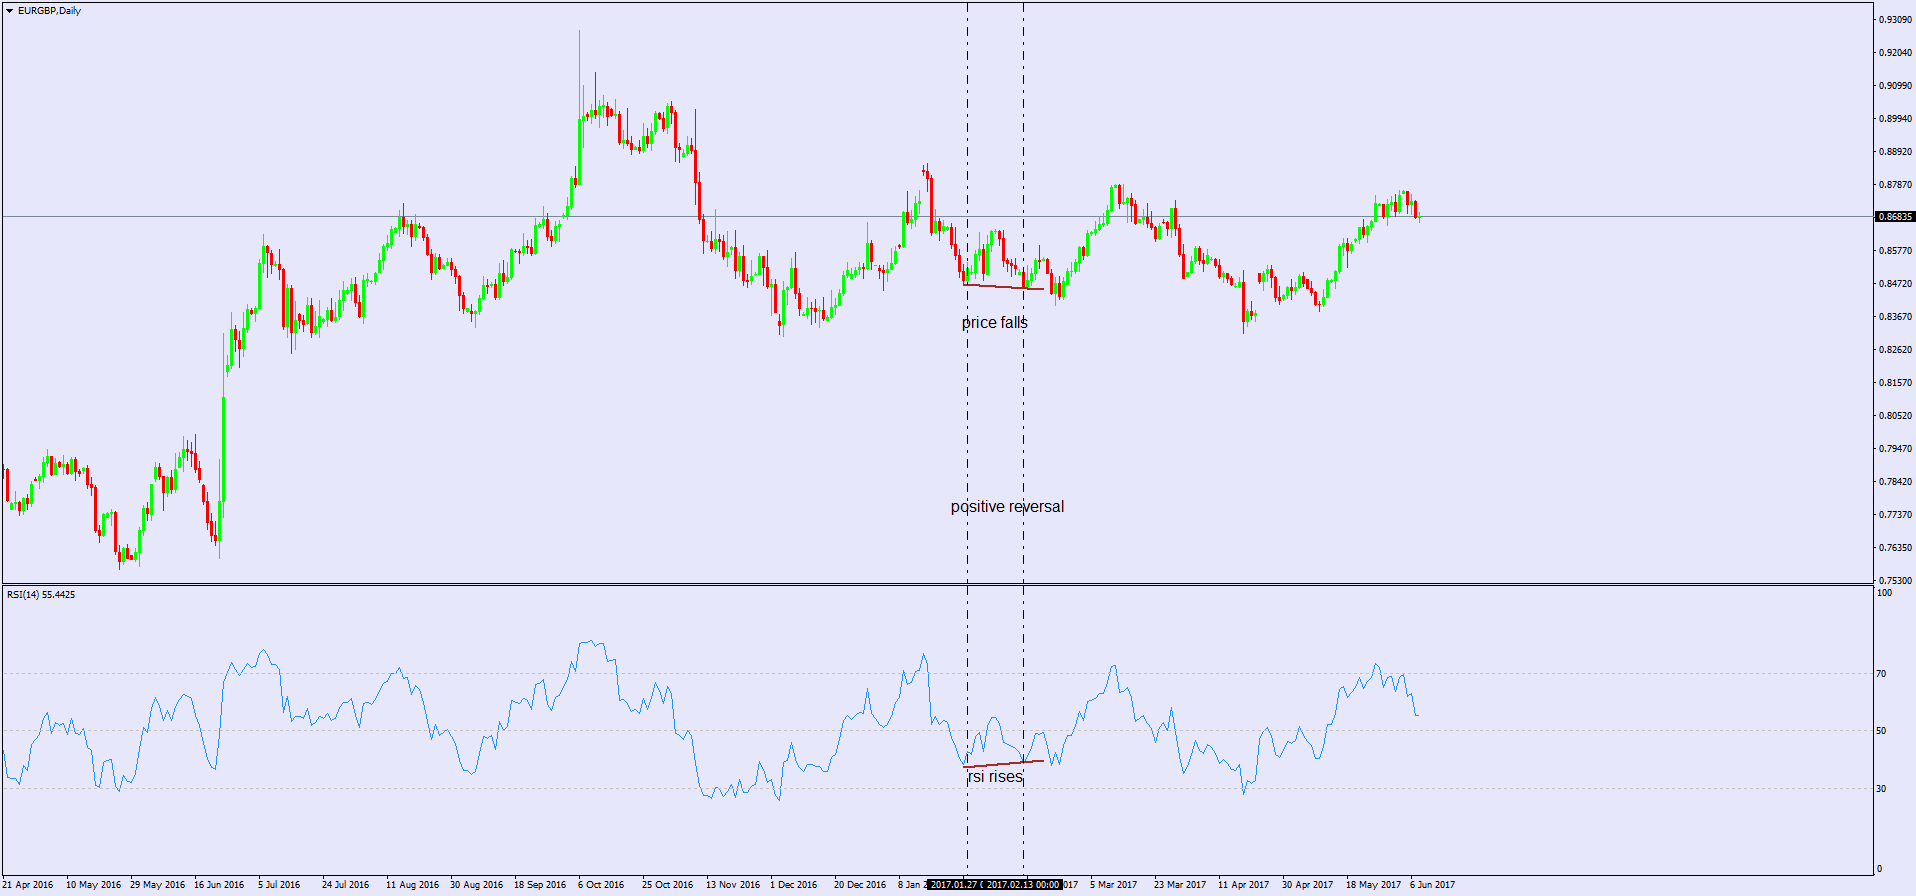
Perhaps, this is the most powerful Forex rsi trading strategy of them all. In a bearish setup, the price makes two highs while the rsi doesn’t confirm them. Moreover, the rsi stays in normal ranges. No overbought or oversold level interferes.
These patterns do not form that often. But when they do, they tell us the future direction of a currency pair.
Conclusion
Traders wondering what is rsi Forex oscillator, now have an answer. This is one of the most complete oscillators offered for free for the retail trader.
Not all indicators out there are for free. But this doesn’t make them any better.
When trading with an oscillator, the important thing is to look for different ways to interpret it. If everyone knows that we should sell in overbought and buy in oversold territory, why do traders lose money?
Like the strategies with the Forex rsi indicator explained here, we can use that statement but adapt it to market conditions. In other words, a small trick and profitability comes.
Moreover, keep in mind that any indicator, rsi included, shows the same thing. You can use a divergence to buy or sell, you can use overbought and oversold levels, etc. But what would make your trading style different is to adapt these to the current market conditions.
You know, in trading, there are to “books” any trader should read:expectations and reality. If you come to the market with a $1000 account and want to turn it in a million overnight, your expectations do not match reality.
The same with any oscillator. What is an rsi indicator if not a tool to help traders understand future price action? The problem comes from the expectations behind using it.
To sum up, one needs to know when to trade with the rsi indicator, how to use the Forex rsi and what to expect from trading it. Together, these may be part of a powerful and profitable trading system.