Few trading concepts gained in popularity like harmonic patterns. In fact, retail traders use various harmonic patterns Forex strategies to find the perfect trade.
There’s a reason why traders love them. They come with a clear setup, giving an entry and exit place. Moreover, the risk-reward ratio is one of the best.
The Forex market as we know it today is a strange place to trade. The idea is a very simple one. Retail traders buy or sell a currency pair.
If they are right about the direction, they make a profit. The difference between the entry and exit price is the profit.
But, this simple concept, proves to be very difficult in the long run. Constant profitability comes with great costs.
Traders need to find an edge to constantly beat the market. For some, that edge is a trading system based on technical indicators.
For others, it is fundamental analysis and the way economies change around the globe.
Yet, for other traders, some trading theories dominate their actions. The Elliott Waves Theory is one of them. Harmonic patterns Forex strategy is another.
As a coincidence, both theories originated from about the same period. Early nineteen hundred, Ralph Elliott put the basis on the Elliott Waves Theory.
Harold Gartley (the father of harmonic patterns) was born in Newark, New Jersey, in 1899. By 1935, his “Profits in the Stock Market” book revealed for the first-time harmonic patterns Forex traders use to this day.
It may or may not be a coincidence, but the two great theories were developed at about the same time. Moreover, they both looked at the stock market. And, they incorporate human behavior.
This article aims to show you the power of harmonic patterns and how harmonic patterns Forex strategies influence traders today.
Harmonic Patterns Definition
Gartley’s contributions to technical analysis proved impressive. As such, MTA (Market Technicians Associations) recognized his work. Because of that, we can say today harmonic trading started with H.M. Gartley.
The Gartley pattern changed in time. This is only normal. It happened with the Elliott Waves Theory too.
If you look at how the Forex market moves today, you have an answer for why patterns change. Firstly, it’s a different market. Secondly, it has different players. And, finally, it’s mostly traded by robots.
Yet, these patterns hold the test of time. The power of a pattern recognition approach comes from the way traders integrate the results into a trading system.
Harmonic trading offers great opportunities. Any harmonic analysis starts with a bullish or a bearish trend. That’s the A-B segment.
It represents a significant trend move. Or, impulsive phase. The market makes little or no pullbacks.
However, at the end of the A-B segment, the market manages to push. Traders try to reverse the trend. This small countertrend price action is the B-C segment.
Traders experienced in harmonic patterns recognize the B-C segment easily. They look at the previous swing in the A-B trend. The B-C leg needs to break it.
But, it’s not enough for a trade. The B-C price action tells much about a possible reversal. However, it is merely the result of traders covering positions after a sustained trend.
Gartley recommended waiting for a 33%-50% pullback of the B-C segment before taking a trade. Therefore, most harmonic patterns Forex strategies use such pullbacks.
Obviously, no harmonic trader uses the system without a stop loss. And, on top of it, a proper risk-reward ratio.
The end of point B gives the stop loss, while 1:3 or even more represents a proper risk-reward ratio.
Harmonic Patterns Forex Constraints
To this day, harmonic patterns give very good results. No matter the market traded.
The Forex market is known as being extremely volatile. The prices spike out of nowhere. Either a news or simply some aggressive buying/selling, send prices higher/lower.
As such, to make it in this market, one needs a system. A harmonic trading indicator may be such a system, with one condition: to have a solid risk-reward ratio.
The basics of the Gartley pattern as described earlier, allow for such risk-reward ratio. But, traders must follow the rules. Blindly.
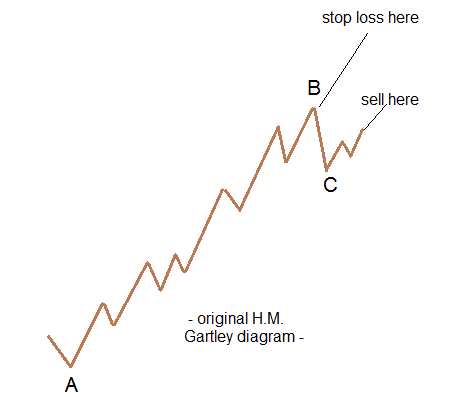
Firstly, wait for the pullback that takes the previous swing. In the case above, the B-C pullback takes the previous swing’s low.
Secondly, the market needs to retrace. Again.
Why does this minor pullback take place? It could be because of late bulls. These were anxious to go long. But, they didn’t get any chance on the A-B segment.
These “late bulls” give the entry for a short trade. The stop loss must be set at the highs of the B point. And, proper harmonic patterns Forex traders use should reach for minimum 1:4 risk-reward ratio.
There’s a reason for that. In this arrangement, the setup fails often. But, when it works, it covers for the losses. And some more.
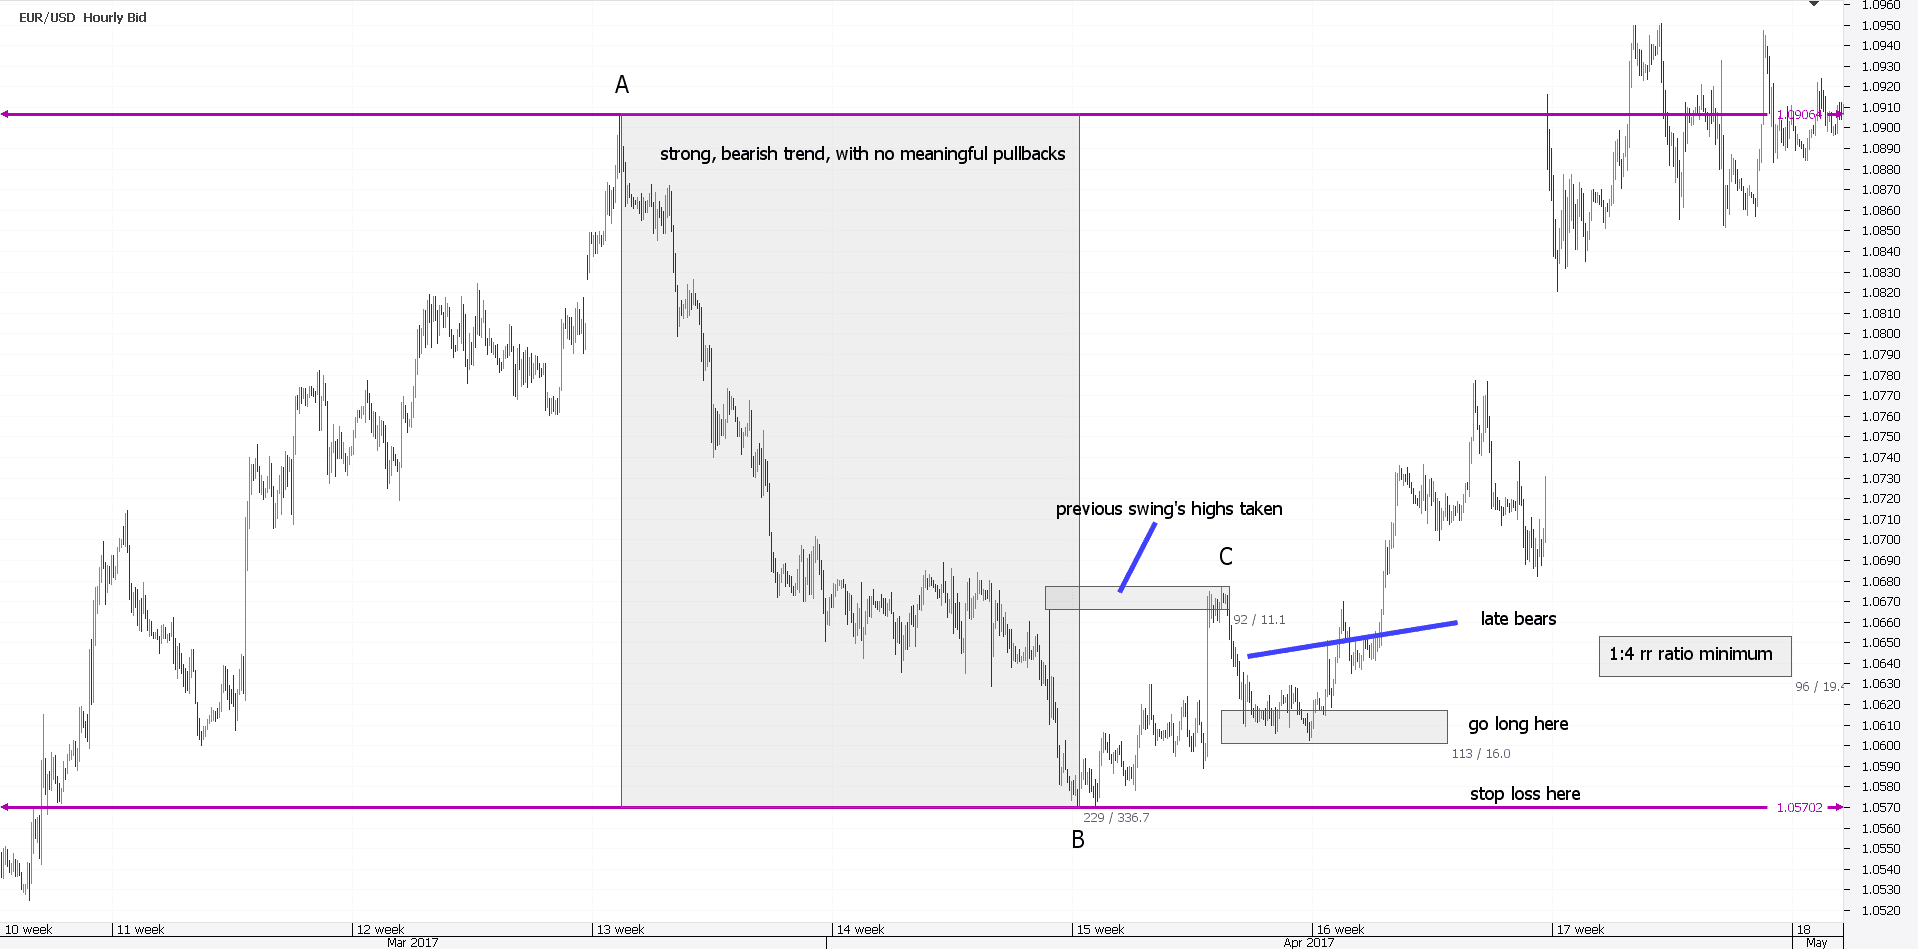
Here’s what harmonic patterns Forex traders use these days. The trade above on the EURUSD hourly chart respects ALL the rules from the basic Gartley diagram.
The B-C segment seems to be key here. And, keep in mind that the stop loss is mandatory!
Almost a hundred years of history didn’t change human behavior. Harmonic price patterns may change in time. But, the old idea still exists. And, it works even on the Forex market.
Forex Harmonic Patterns – The Gartley 222
In time, harmonic patterns changed. The need for new rules became obvious.
Not that the classical Gartley approach doesn’t work. But, technical analysis evolved. Technicians like Elliott and Gartley were only opening the road for more.
Traders became aware more and more about the power of Fibonacci numbers. In a way, the Gartley harmonic patterns Forex strategy uses a retracement before the entry. Why not including a Fibonacci ratio?
The next change to the harmonic trading patterns came with Larry Pesavento. The so-called “Gartley 222” pattern revolutionized harmonic patterns from that moment on.
You already know what a Gartley 222 is. Just look at the classical Gartley diagram explained earlier.
In his book, Gartley displayed it at page no. 222. In the early 1990’s, Larry Pesavento took the pattern to new levels.
He soon discovered that a harmonic pattern trading strategy that incorporates Fibonacci retracements has more power. Much more power.
As such, the Pesavento’s Gartley 222 harmonic trading indicator appeared.
Despite robots doing most of the today’s trading, humans program them. As such, the human touch, or factor, to harmonic patterns or any kind of patterns still exists.
How to Trade Harmonic Patterns – The Pesavento Approach
A pioneer of geometry in trading, and a big Fibonacci ratios fan, Pesavento took harmonic patterns to a new level.
The Gartley 222 appeared. According to Pesavento, these harmonic patterns Forex traders can use, form a powerful system.
First, a Gartley 222 has an A-B-C correction. Next, it considers the price at a Fibonacci level (golden ratio at point C). Moreover, it offers an excellent risk-reward ratio. And, finally, it has a stop protection at point A.
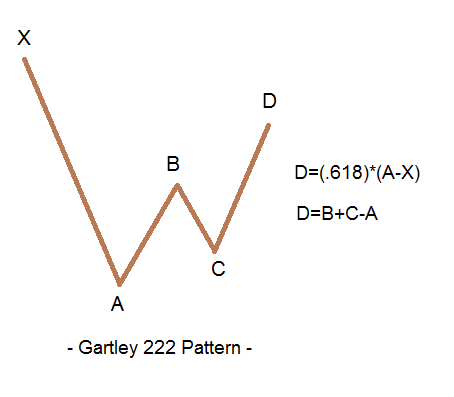
The Gartley 222 pattern appears above. It considers four points for a reason: Pesavento used the A-B-C correction to forecast the D point.
However, the formula on the right side of the pattern is not Pesavento’s. It belongs to Charles L. Lindsay.
Still, it has plenty of applications in harmonic patterns. Pesavento noticed its power and from here to the now famous AB=CD was just a small step.
A small step for a trader. A huge one for technical analysis.
Gartley 222 Rules in Harmonic Patterns
Harmonic patterns Forex strategies that use the Gartley 222, follow specific rules. Here are the conditions for a bearish Gartely 222 pattern:
- The swing up from point A ends at point D. Seventy-five percent of the times, this swing ends at 61.8% or 78.6% retracement of the X-A segment. Rest of the times, the market travels to a different Fibonacci ratio.
- AB=CD is mandatory.
- BC=61.8% or 78.6% of AB. However, in strong markets, this pullback is shorter.
Moreover, Pesavento found that the AB and CD equality gives more power to harmonic patterns. Nowadays, harmonic patterns software integrates this equality between the two segments.
A Forex harmonic scanner is easy to program and run. Moreover, a Forex harmonic indicator mt4 can be easily installed. This way, the harmonic patterns Forex traders use these days appear automatically.
Pesavento found another interesting aspect. When the AB=CD rule gives a target around point A, a double top or bottom forms.
But, if the market has the power to push through point X level, it will not stop. This is a powerful sign and the next level of interest will be 127% or 161.8% of the X-A segment.
While the Forex harmonic patterns indicator mt4 today plots the patterns automatically, they don’t resemble the Gartley 222. Yet, traders that know their way with harmonic patterns use the Pesavento approach manually.
However, the AB=CD equality was first noticed by Gartley…His innovations to technical analysis lead to harmonic patterns being so popular today.
Building the AB=CD Harmonic Patterns Forex Strategies
The first one that noticed the power of the AB=CD rule was Gartley. In these findings, he used the classical technical approach to demonstrate this.
The idea is a simple one. Firstly, look for an A-B-C correction. Second, build the A-C trend line and project it in such a way to form a channel.
If the trend is rising, you just built a bullish channel. Next, project the A-B distance from the end of the C point.
The D point corresponding to the AB=CD harmonic patterns represents a selling point. However, the projected target is only the lower side of the channel.
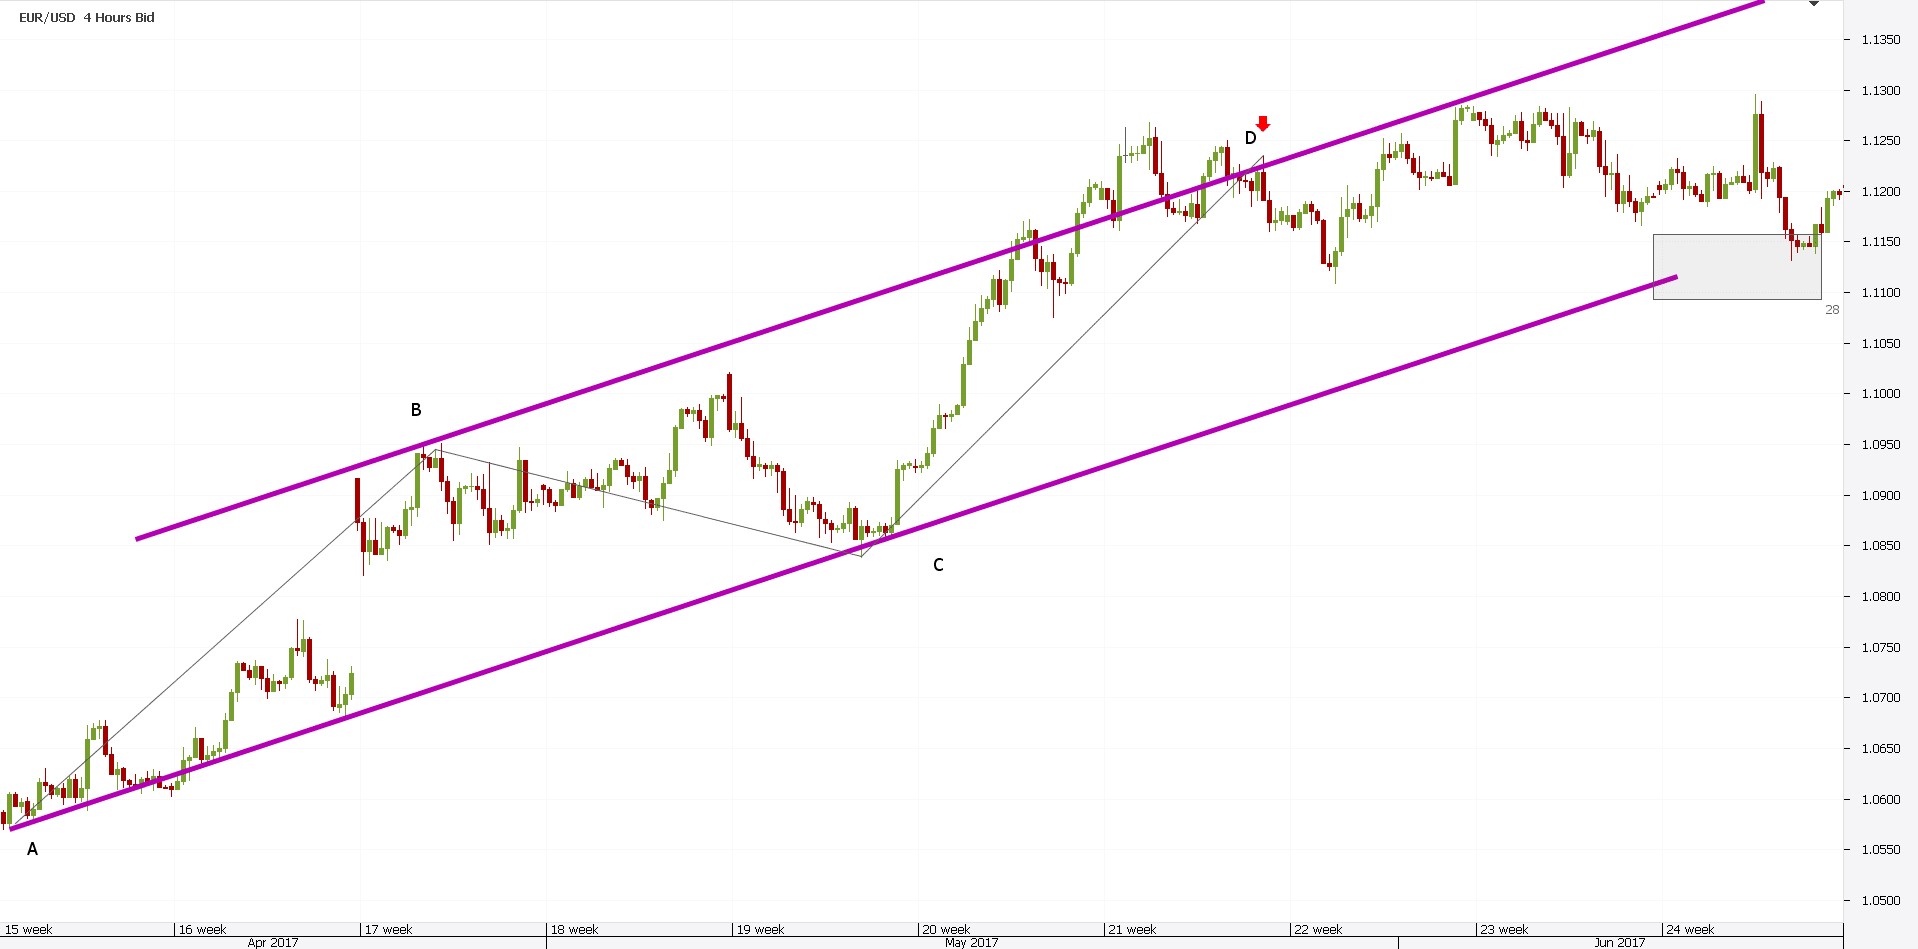
The reason for that is straightforward. While the AB=CD rule gives the perfect selling point, the market may only consolidate until reaching the A-C trend line again.
Gartley noticed that and that’s why he set such a small target. Some find this a terrible approach to harmonic trading. But, it comes from a disciplined trading system.
Strong markets will result in new highs. Powerful trends have the tendency to resume when coming to the lower side of the channel.
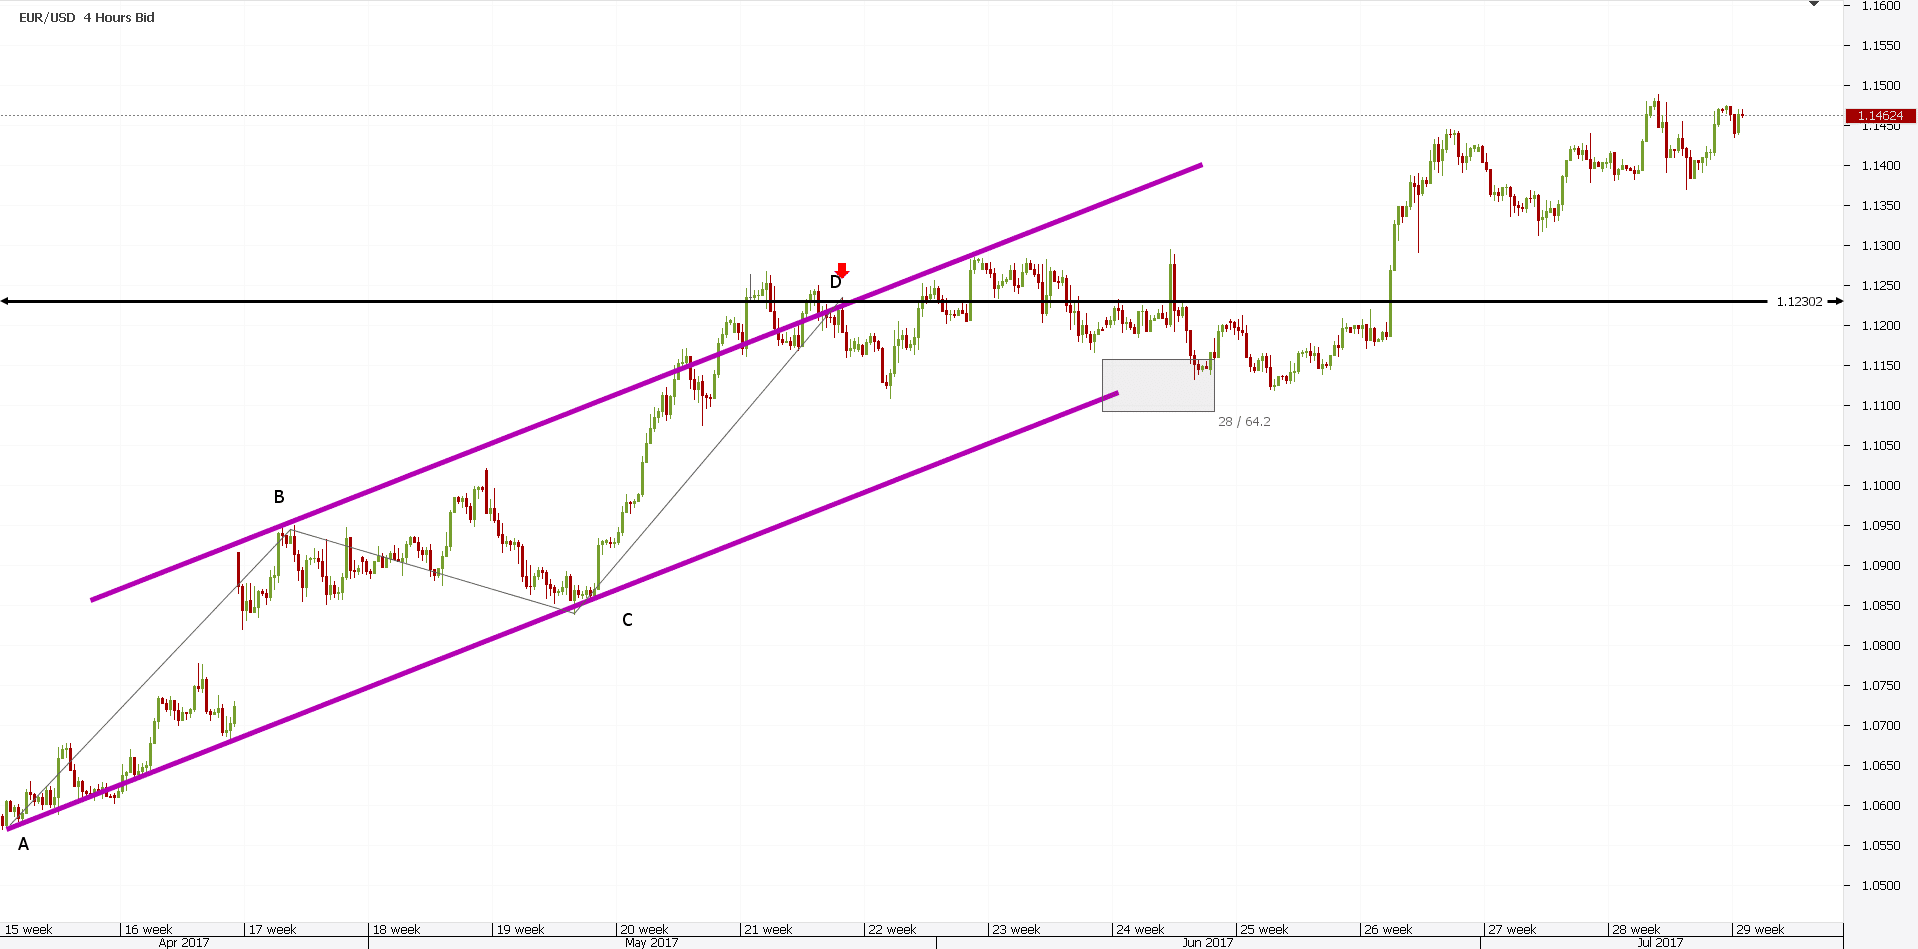
This EURUSD example illustrates this perfectly. After the AB=CD, the market consolidated for a month. A whole month, until reaching the lower side of the bullish channel.
Traders that ignored Gartley’s approach to the AB=CD ratio will pay a tough price. The market exploded higher, tripping stops after stops.
Yet, this AB=CD is the basis for the modern harmonic patterns indicator mt4 platform offers. Only that, it has different names.
Carney’s Approach to Harmonic Patterns Forex Trading
So far, we saw what makes harmonic patterns. Moreover, the methods presented here respect the original approaches to harmonic trading.
But, not even the Pesavento’s approach wasn’t enough. Or, complete.
One of Pesavento’s students/disciples wasn’t satisfied with the results. While the risk-reward ratio allowed for profitable trading, the pattern still failed.
A more accurate view was needed. To improve the pattern’s reliability, more work needed to be done.
And so, the harmonic patterns that we know today, were invented. Scott Carney’s work laid down the rules for them.
As you probably noticed, the Gartley pattern refers to harmonic patterns. It’s like a trademark.
Carney wanted to further define the moves that the market makes. His approach works in any market, regardless of the financial product traded.
This guy insisted that each leg should have a specific Fibonacci relationship with the other legs. In fact, this was the only thing missing from the Pesavento’s approach.
This way, trades were further filtered. Traders will take only the trades that follow ALL the rules and ratios.
Less trading means increased profitability. By the time a trade fits into the pattern, it has more chances to be profitable.
Scott Carney’s Gartley Trading Rules
At the turn of the century, Scott’s rules for the Gartley pattern were made public. To this day, eighteen years later, harmonic patterns Forex traders use are based on those rules.
Carney found that:
- B retraces 61.8% of A.
- The B-C projections can’t exceed 161.8%.
- AB=CD is valid most of the times.
- AB=CD reaches 78.6% of the XA segment.
Here’s how Carney expanded Pesavento’s work. If the price doesn’t meet any of the ratios below, the pattern is discounted.
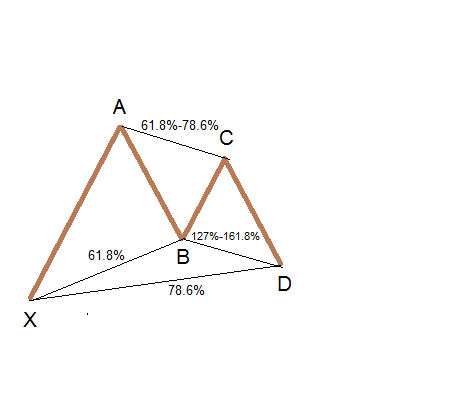
The pattern is more complex than Pesavento’s. Moreover, it has specific ratios or rules price needs to conform with.
Carney will call the pattern a Gartley, only if D reaches 78.6% of the X-A segment. On top of this, the B point should end at 61.8% of the same segment.
When these two happen, the harmonic patterns forex traders use ends with a profitable trade. That is, most of the time.
Today’s trading software allows to automatically plot the Gartley pattern. The harmonic patterns that respect all the rules listed by Carney appear automatically on the screen.
The robot filters them. Based on that, trading results improve.
Fibonacci ratios make the Carney’s approach to harmonic patterns powerful. If one compares the Gartley’s starting point with the final Carney’s interpretation, there are many differences.
But, the only reason why both Pesavento and Carney wanted to improve the original Gartley was better profitability. Their approaches managed to do that.
Yet, the original Gartley stood the test of time. The brilliant idea to look for equal segments was touched by Elliott too.
Moreover, Elliott found time plays an important role as well. But, this is the subject of a different trading article.
Conclusion
History is cyclical because human nature doesn’t change. Trading financial markets perfectly illustrates this.
People overreact, get stopped…However, eventually, they forget the lessons and overreact again. Therefore, a pattern recognition approach to trading still works.
And, will continue to work for as long as humans will act as they do. Or, for as long as humans will exist.
Today’s harmonic patterns Forex traders use differ from the original Gartley’s approach. Almost a hundred years of intellectual advances lead to harmonic patterns change.
But, this article showed the basic principle still works. Robust trades result from these patterns.
Sometimes, only the name differs. Nowadays, traders use automatic software that spots patterns.
As such, triangles, channels, wedges, pennants, flags, head and shoulders…and other patterns appear automatically on a chart. Moreover, a notification appears too. It’s not possible to miss them.
In the world of harmonic patterns, today we can talk about bullish or bearish Gartley. Or, bats, butterflies, crabs, and so on.
But, the idea is the same as the one H.M. Gartley envisioned almost a hundred years ago. If human nature dictates markets, why not putting its behavior in a pattern?
In time, I am sure we’ll see many changes to harmonic patterns. New ways to trade will appear. New trading strategies will be developed.
However, in the meantime, technical analysis proved its efficiency. There’s a solid base to be built on.
To illustrate the importance of Gartley’s work to harmonic patterns, think of this. He printed a thousand copies of his book and he sold them all at $1500 per copy.
To put this into perspective, $500 could buy you a new Ford back then. How many patterns do you know that give you that much power when trading financial markets?
