In the golden times of technical analysis, one name stood above everyone’s: Richard Donchian. Also called the father of trend following, he built the now famous Donchian channel indicator mt4 traders use. Despite its reputation, the Donchian channel indicator is not only a trending tool.
Instead, it plays a vital role in showing volatility. Or, the volatility of a financial product.
Because it deals with volatility too, the Donchian channel falls into a select class of indicators. Tools like:
- Average True Range
- Chaikin’s Volatility
- Volatility Quality Index, and so on, come to complete a volatility’s trader’s arsenal.
However, the Donchian channel indicator has multiple uses. It deals with trend following too.
For many, it looks like the Bollinger Bands indicator. Because the Bollinger Bands also has trend and volatility characteristics, traders’ confusion makes sense.
This article aims to bring the work of Richard Donchian to good use. Why is there a need for such a thing?
As he was mainly a commodity trader, his findings and concepts won’t work on today’s Forex market. Or, not all of them.
The idea is to bring to life what Forex traders can use. Moreover, to explain the Donchian channel indicator mt4 platform offers.
Among other topics, we’ll cover:
- Richard Donchian’s technical analysis legacy
- The best ways to use the Donchian channel metatrader 4 indicator
- Money management rules laid down by Donchian
The idea is to take the best out of his work. And in doing that, to pay respects to one of the founders of technical analysis as we know it today.
Donchian’s Contribution to Technical Analysis
For someone who published his leading work in the middle 1900’s, Richard Donchian is pretty famous. Those were the golden days for technical traders.
Imagine the conditions back then:
- No personal computer. Hence, no trading algorithms, robots, quants, etc.
- No currency markets. Hence, only stock market to “play” with and some commodities.
As such, Donchian’s work came to complete studies like:
- The Elliott Waves Theory by Ralph Elliott
- Harmonic patterns studies by Gartley
- Price and time by Gann
They all published their work around the same years. This makes top technical indicators and trading theories coming from the same group thinking.
Is this good or bad for today’s Forex trading? I would argue that it is both a blessing and a curse.
It’s a blessing before future generations had a starting point. Using different tools (e.g., personal computers), today’s traders took old concepts to new levels.
For example, think of a Donchian trend system developed on 1940’s commodity market. Would it work in today’s Forex market?
Most likely not. Today’s traders simply open a chart on their trading platform. Next, they apply the Donchian channel indicator. Finally, buy and sell based on this channel indicator.
Moreover, all Forex traders heard of the Donchian channel indicator mt4 offers. But few know its original use was on the daily chart only.
Yet, traders use it on all time frames:
- Scalpers, on one-minute and five-minute ones
- Swing traders on hourly and up to daily ones
- Investors use daily and bigger time-horizon for their trades
Now comes the real question: how many Forex traders today are investors? The right answer: few of them.
Because of this, the Donchian channel indicator is tricky to use on the Forex market.
The General and Technical Guides of a Donchian System
While most people think of a Donchian system like a bunch of technical indicators, that’s wrong. Above all, Richard Donchian was a money management master.
In fact, he was a pioneer in this field. Moreover, the rules he laid down find great use in today’s Forex trading too.
As such, if we are to start from somewhere, money management is the right place. And, for a good reason!
I won’t list here all the rules and guides he made famous. However, I’ll mention the most popular ones.
In doing that, you’ll see that you, as a Forex trader, heard them. Know them. But, you didn’t know they were made almost seventy years ago.
Because the market is a sum of human behavior, money management concepts work in all areas. Forex trading included.
Here we go:
- The use of a stop loss is an aid to profitable trading
- Limit losses, ride profits
How many times you’ve read “let your profits run.” Or, “cut your losses”. Now you know where it comes from.
In technical analysis, Donchian was among the first ones to explain a sideways consolidation. What is that?
In today’s world, think of an ascending triangle. Or, a contracting one. Even more, of a pennant, or bullish flag.
All these are continuation patterns or sideways consolidation areas. And, on of Donchian’s contributions was to state that price would most likely make another advance after sideways trading.
Trading with the Donchian Channel Indicator
The Donchian channel indicator mt4 traders use has a simple structure. It is made of:
- A 20-period default high
- A 20-period default low
- One middle band that shows the average of the two.
Beware of what was mentioned earlier. The indicator work’s best on daily charts. As such, we’ll use the daily time frame to illustrate its effectiveness.
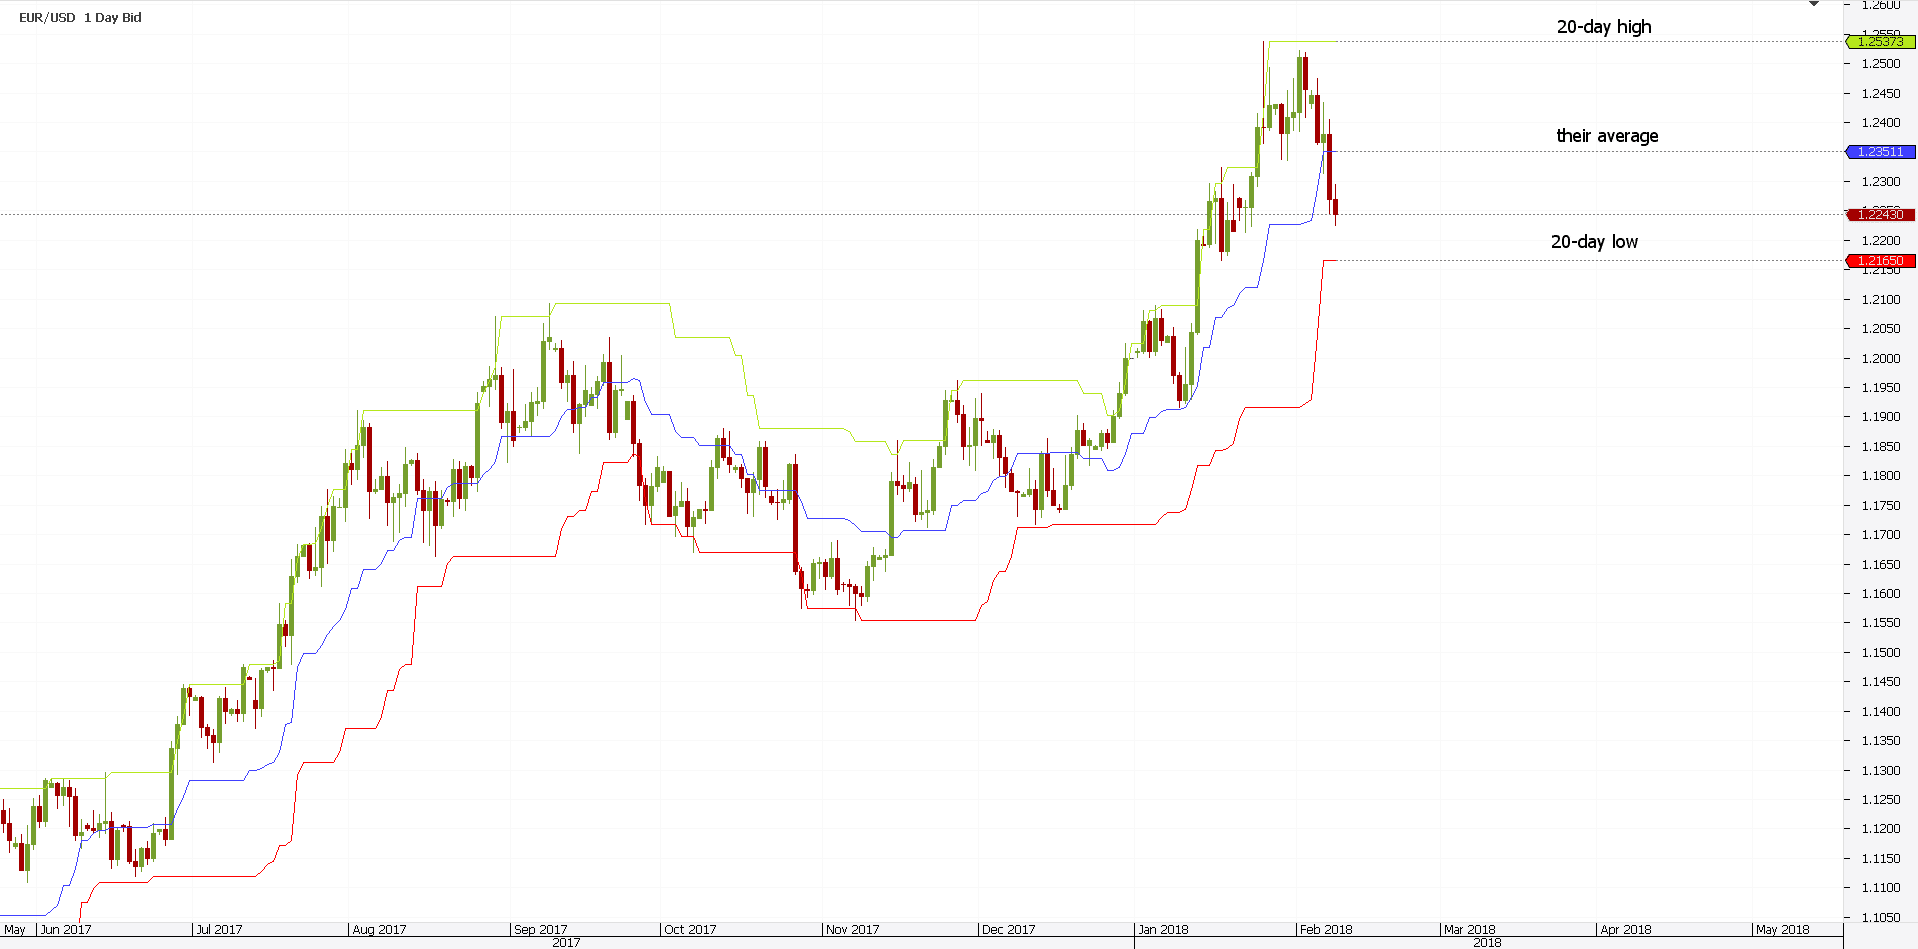
The EURUSD chart above explains it all. The Donchian channel indicator’s lines define a perfect range.
For the current prices:
- 2537 represents the 20-day high
- 2165 is the 20-day low
- 2351 is the middle point. Or, their average.
What’s interesting to know is that the Donchian indicator doesn’t include the current bar in its calculation. Therefore, it considers only the previous 20 days.
The beauty of the Donchian channel indicator comes from its simplicity. As always, simple things work best.
In technical analysis, that’s very much true. Complicated technical indicators make the like of a trader a nightmare.
Because of that, the Donchian channels indicators is one of the best technical indicators for day trading.
There are many ways to trade with the Donchian channel metatrader 4 platform offers. Here’s a list outlining some of them:
- Trend riding
- Find support and resistance levels
- Use an oscillator to filter entries and exits
- Volatility breakout with the Donchian channel indicator
Trend Riding with Donchian Channel Indicator MT4
Trend riding is everybody’s dream. But, dreams and reality differ.
Because the Forex market spends most of the time in consolidation, riding trends becomes difficult. As such, traders struggle to find the start of a trend.
Above all, they lack patience. If you use the Donchian indicator to find a trend on the daily chart, you need patience. A lot of it.
The rules of engagement for trend riding are:
- Buy when the price closes above the upper band.
- Sell when it closes below the lower band.
Here’s the EURUSD daily chart showing one year’s worth of data. It applies the rules listed above.
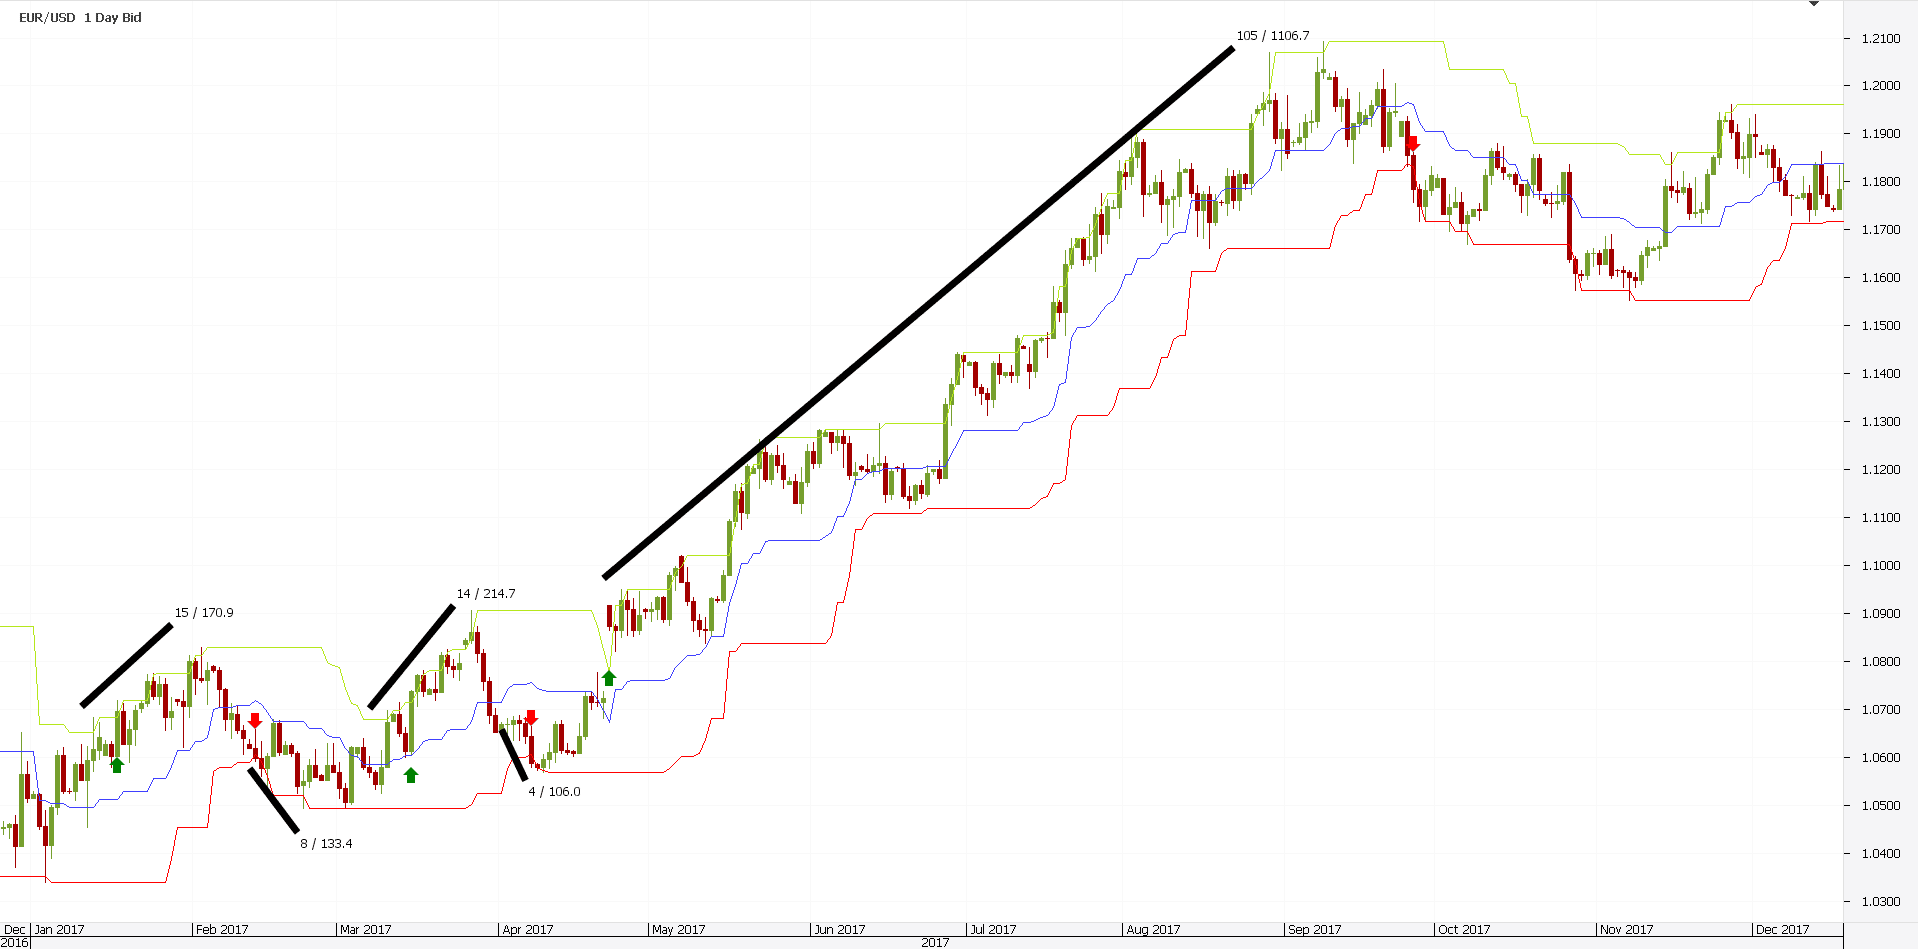
But the entries have an unfortunate timing. However, a simple approach like this was enough to catch the big trend.
And, if you look back at 2017, the main trend in the FX market was long on the EURUSD pair. Therefore, a simple Donchian trend system like this one was enough to spot it.
Filtering the Donchian Trend Riding Entries
The approach above is too simple. That is, too simple for the Forex markets.
It may have worked in mid-1900’s. And, on a different market.
But for today’s currency market, traders must add something. That’s a trading plan.
And, like all trading plans, we need exact rules for:
- Entry
- Stop loss
- Exit
Here’s a Donchian system to test:
- In a bullish trend
- Buy a break above the upper line only if
- The price didn’t break below the lower line on the previous dip
- Put the stop loss at the lower line
- Target 1:3 risk-reward ratio at minimum
- Buy a break above the upper line only if
- In a bearish trend
- Sell a break below the lower line only if
- The price didn’t break above the upper line on the previous spike
- Put the stop loss at the upper line
- Target 1:3 risk-reward ratio
- Sell a break below the lower line only if
Following the rules above, here’s where the right entry on the EURUSD chart would be:
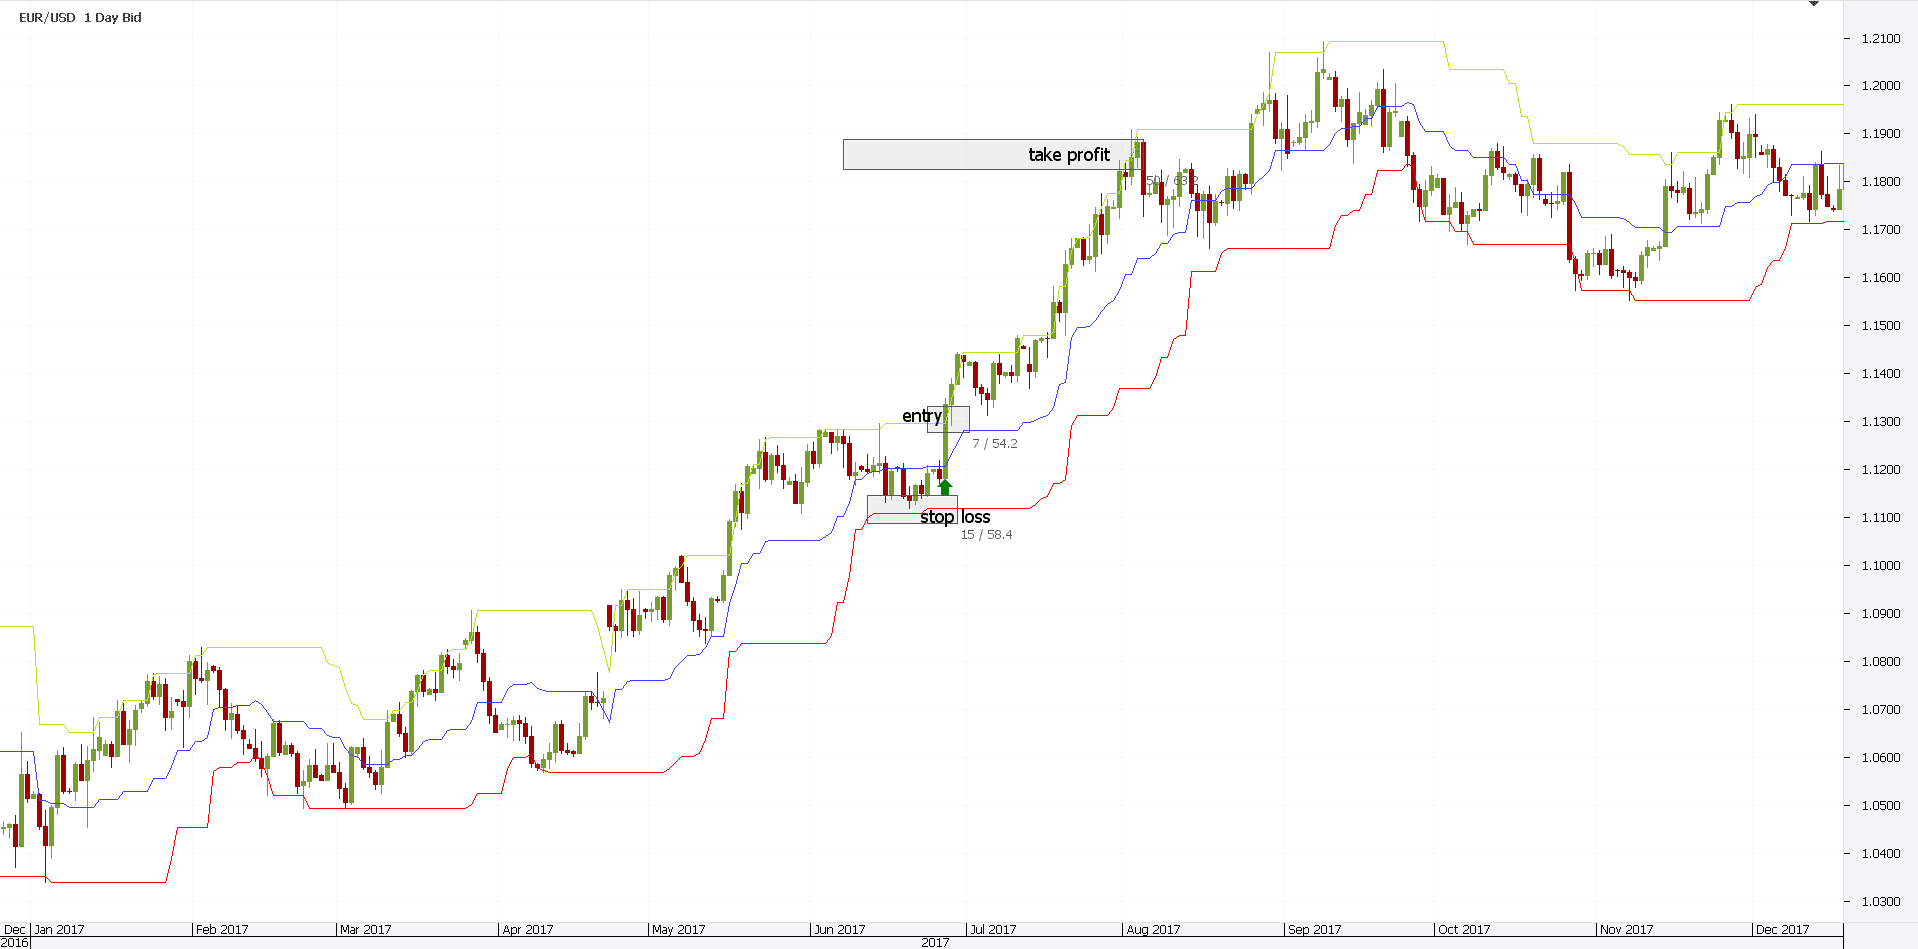
While not the perfect entry to catch the whole trend, it filtered the bad signals. As such, the approach is more conservative. But safer.
Support and Resistance Levels with the Donchian Channel
That’s pretty easy to do with this indicator. A long line, either at the upper or lower part of the Donchian channel indicator mt4 traders use, shows support or resistance.
The inability of price to advance or decline shows a confluence area. Such areas are difficult to overpass. As such, they become support and resistance.
Check the EURJP below. It shows the Donchian channel indicator on the daily time frame.
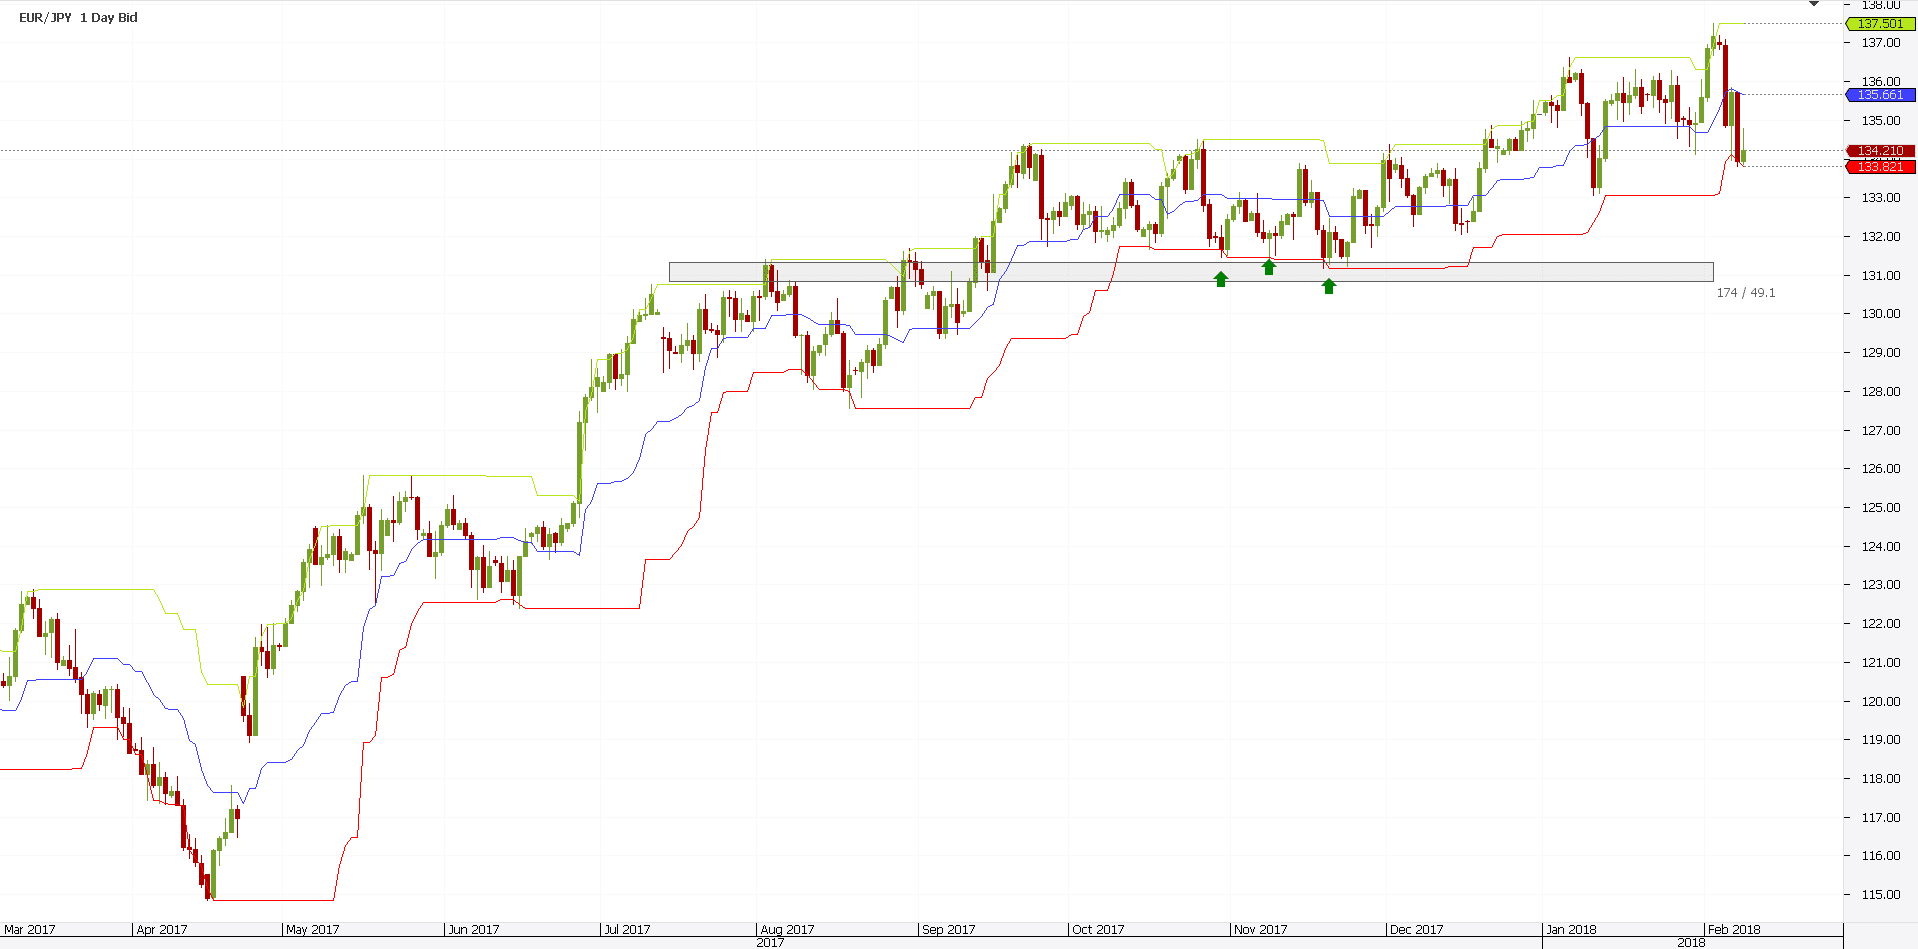
The long upper line during the 2017 summer months proved a great resistance. Once broken it turned into support.
Moreover, when the price tested the support, it failed to close below. That is, below the lower Donchian band. Another bullish sign that helps to stay on the right side of the market.
Oscillators with Donchian Channels MT4 Indicator
The example presented earlier was ideal. The EURUSD did break higher. And, in doing that, it took bears by surprise.
Little or no pullback followed. However, that doesn’t happen often.
Most of the times the market trips stops to the upside. Then turns and eyes the ones on the downside. And so on.
Such price action shows the Donchian channel indicator’s limitations. As a trend indicator, it mostly fails.
Traders end up being on the right side of the market. But, waiting for the risk-reward ratio proves costly.
Therefore, help could come handy. And help, in this case, has a name: oscillators.
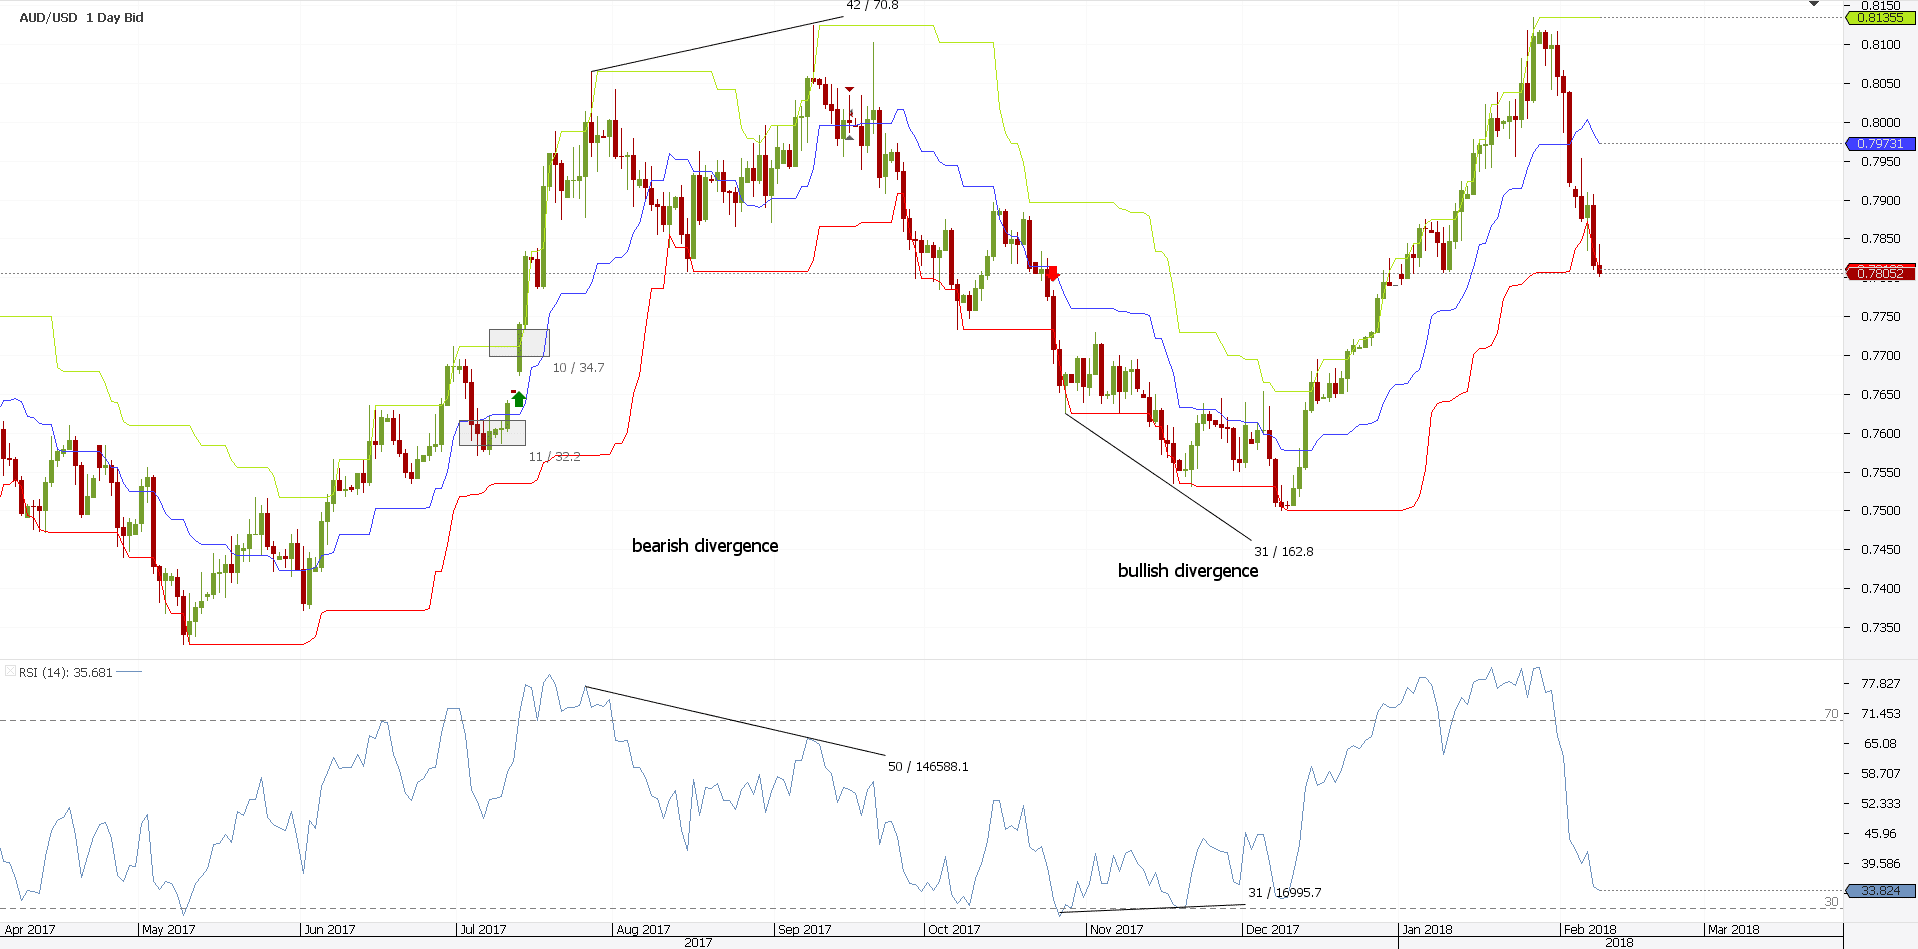
The AUDUSD chart above shows the RSI too. Or, the Relative Strength Index.
An oscillator’s main use is to spot divergences. Namely, divergences between the price and the oscillator.
The chart uses the RSI to time exits, but any oscillator works. Just keep in mind that price typically tends to make fake moves. Not the oscillator.
The two entries followed the system described earlier. From left to right:
- Wait for a pullback below the middle band.
- Go long at the next breakout
- Stop loss at the lower band
- Stay for 1:3 rr
BUT, there’s a catch. The RSI forms a considerable divergence. A bearish one.
And, the trade didn’t reach the take profit. What to do? EXIT, of course. Take the money and run away!
The same happens with the following short trade. Only this time, the RSI forms a bullish divergence.
Exiting earlier is a sign of recognizing a change. Reacting to it is healthy for a trading account.
Donchian Channel Indicator as a Volatility Measure
To use the Donchian channel indicator, mt4 traders must upload it to the platform. It doesn’t come with the default settings.
A simple Internet search tells you this is a trend indicator. If you consider Donchian as the father of trend following, then yes, that’s true.
However, the real use of it is to measure volatility. Or, to spot irregular volatility before a breakout.
Next, to trade that breakout for a profit. Finally, rinse and repeat the process.
Luckily, the concept works on the currency market too. And, with so many currency pairs available, volatility gives plenty of opportunities to trade. Even if the daily chart requires patience.
Volatility Breakouts Rules with the Donchian Indicator
As always, setting rules only help. And this time, it requires a bit of historical research.
The thing to look for is periods of time when the Donchian upper and lower lines narrowed the most. Or, not the most, but the narrow to be smaller than normal.
That’s happening before a major market break. That’s the true use of volatility in Forex trading.
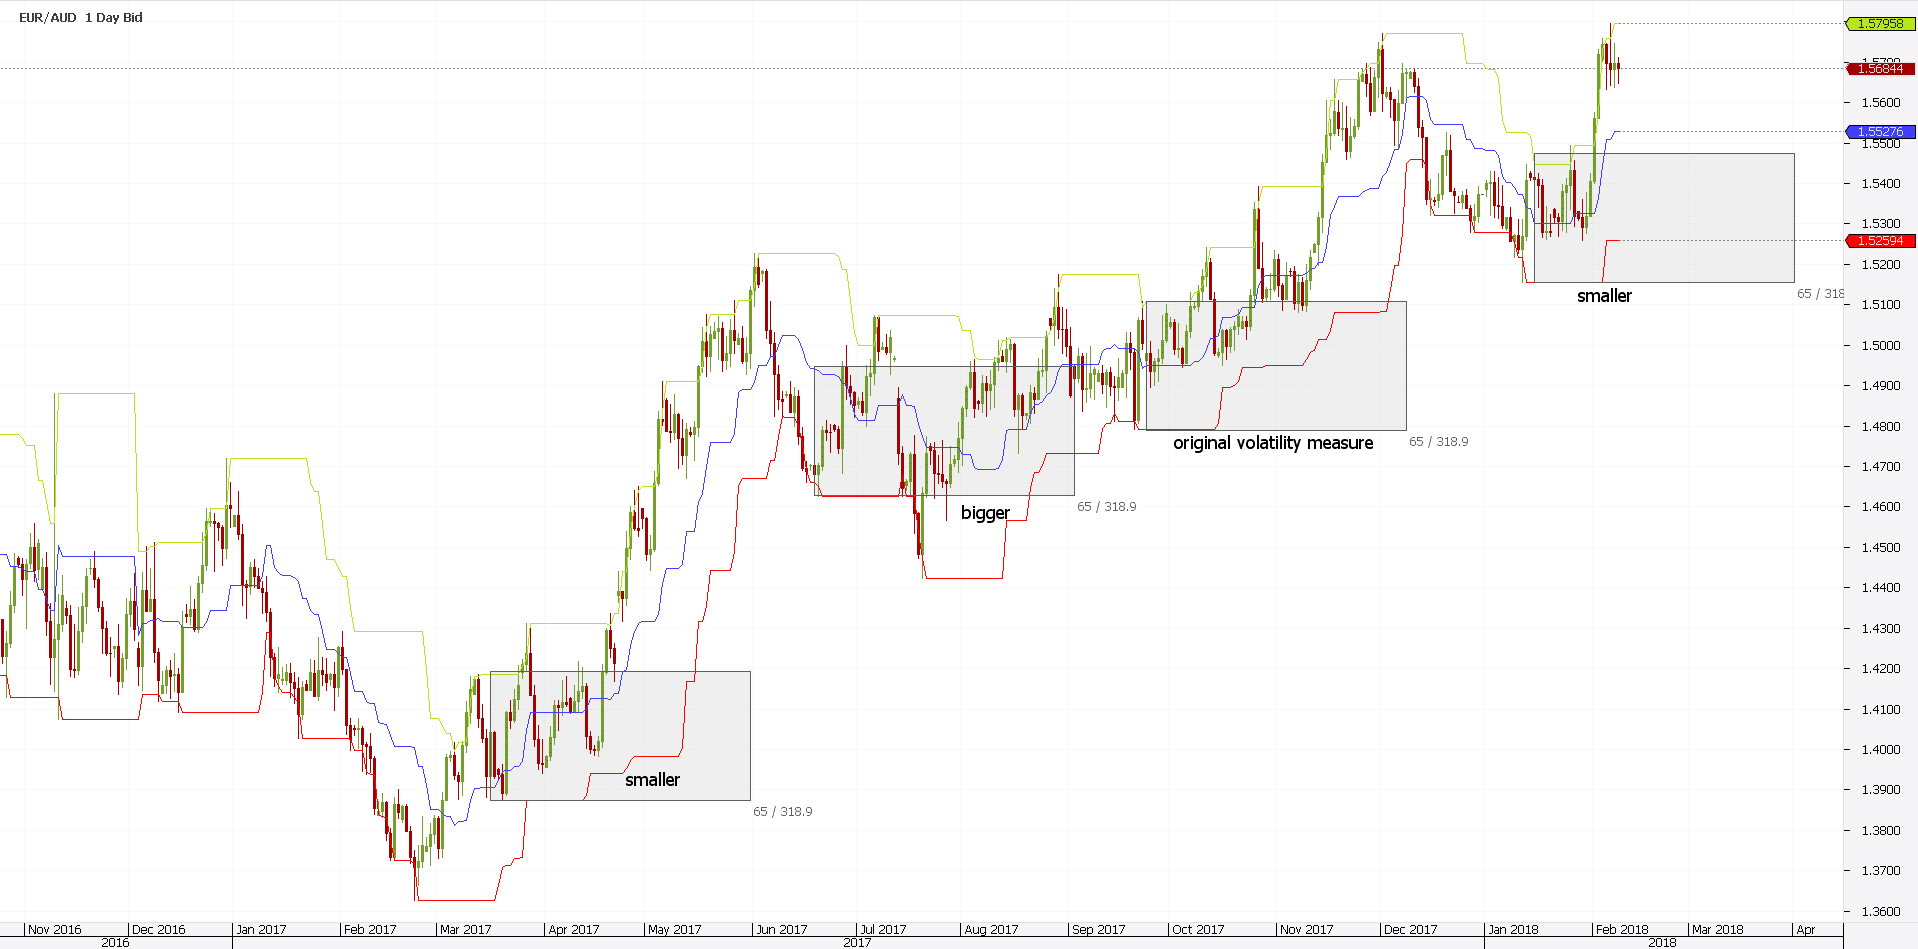
On the EURAUD chart above you see the daily price action over the last fourteen months. The original volatility measure uses a square to depict the corridor between the upper and lower bands.
Next, copy the square and project it every time you see the bands narrowing. If they narrow more than the square shows, that’s a signal to trade the next break.
It shows the market is about to break, as volatility will pick up after such a narrowing. On the other hand, if the contraction is more significant than the measured move, just ignore the next breakout.
Using the logic described above, out of the three situations, only two represent a real signal.
Entry, Exit and Stop Loss with Donchian Volatility System
Now that we know when to expect a real breakout using volatility, we need some rules. Or, trading rules.
First, we must set the entry. This is straightforward: in a bullish trend, buy the break above the upper band.
Second, set the stop loss at the previous swing lower. Having a stop loss is a mandatory condition for every trade.
Finally, set the take profit using a 1:2.5 or 1:3 risk reward ratio. Even better, use trailing stops to right the upcoming trend as long as possible.
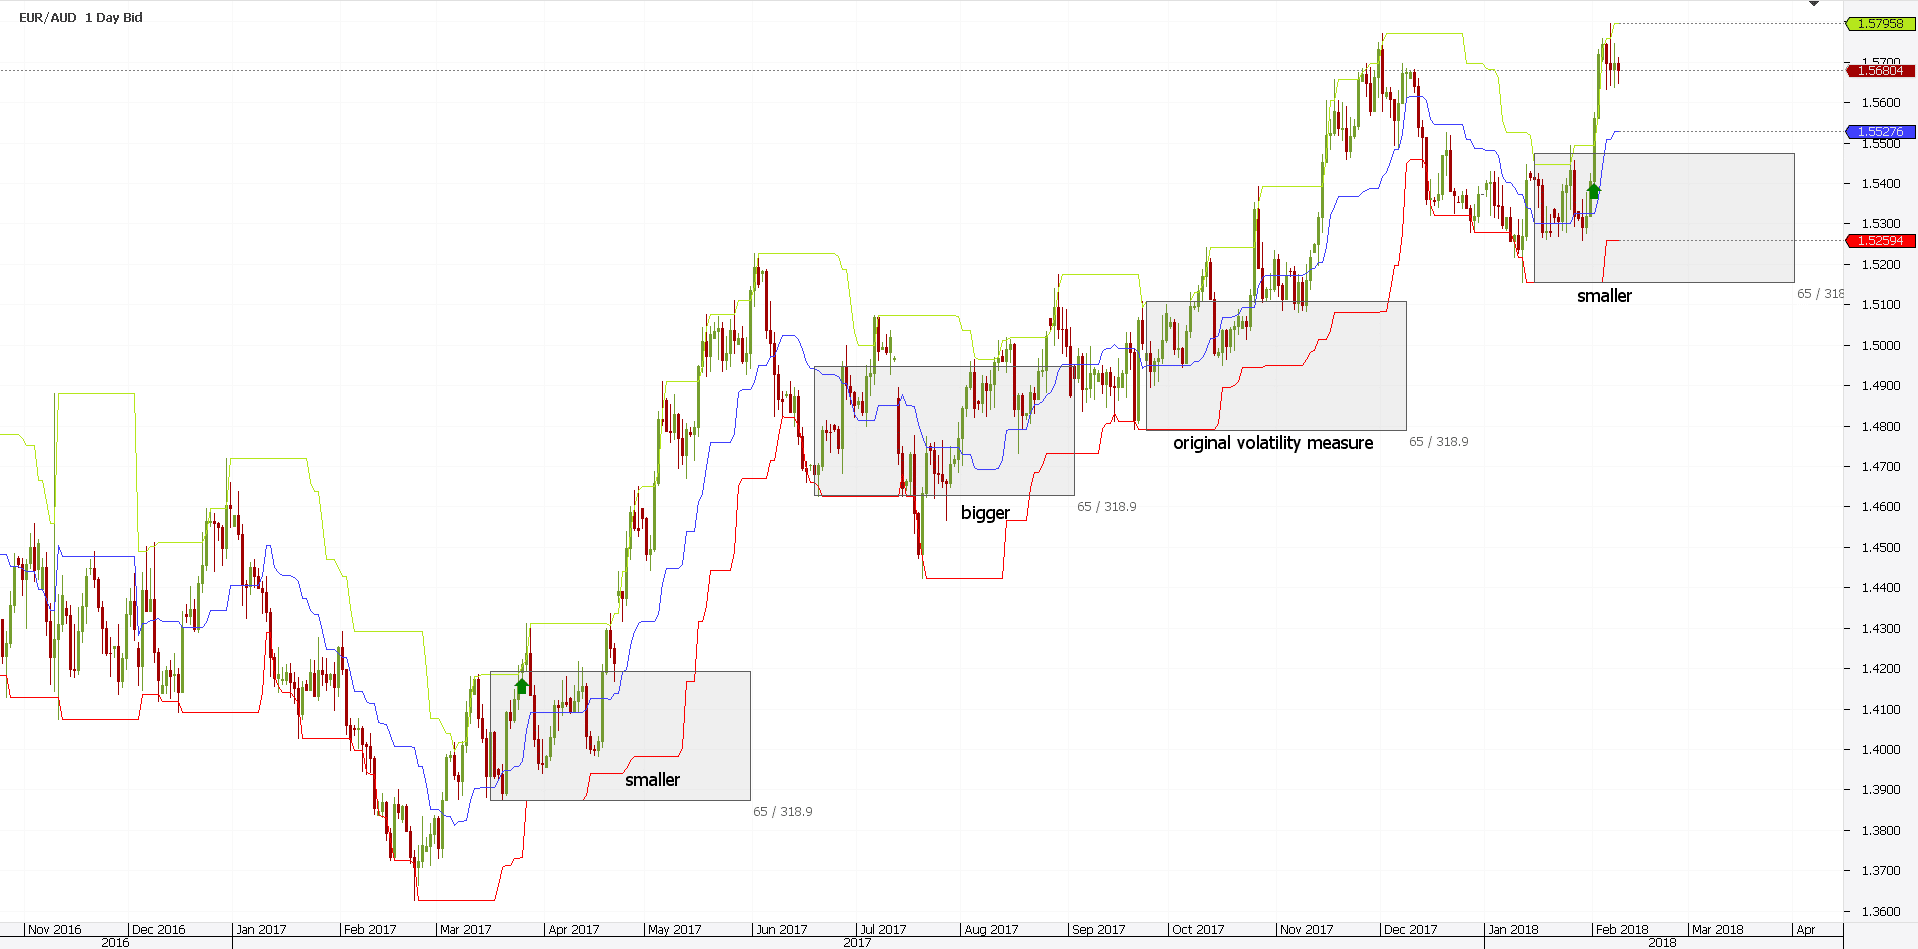
From left to right, the first square tells us a breakout comes. It turned to be bullish and proved to be a great trade.
Following the above rules, the take profit gets hit fast. Using a trailing stop, the trade might still be in place.
The second square shows the bands missing the volatility signal. Hence, both the upper and lower breakouts should be ignored.
The third square is our measured move. Let’s skip it this time.
But the fourth is another great entry. Still on the long side, with quite a tight stop loss.
Conclusion
The Donchian channel indicator has multiple uses in Forex trading. However, it has some serious limitations.
Using concepts developed for other markets may not work in Forex trading. Therefore, the original Gartley pattern was revised by technical traders multiple times in the years to come.
This is why the original Elliott Wave Theory needs some adjustments for the Forex market. And, this is why the Donchian channel indicator mt4 traders use, must change too.
The classic approach to buy and sell upper or lower breakouts doesn’t work. Or, it fails most than it works.
Markets these days consolidate. In a trading week, most of the days are ranging ones. As such, traders must bring something new to the trading table.
One possibility is to use an oscillator to filter fake signals. We covered that here.
Another one is to use the indicator differently and originally. We covered that too, using it as a volatility gauge.
In fact, some prominent brokerage houses offer the Donchian indicator as a volatility one. Not as a trend following tool.
For traders, it shouldn’t matter. In the end, the right approach is the one that makes pips. Constantly.
This article stressed the importance of using the right time frame. I’m not saying different timeframes won’t result in profitable trades.
Only that the daily chart provides better support and resistance levels, and the overall interpretation is in line with the original intent.
Add a sound money management system and some rules to trade, and the road to profitability is open.
