One of the best volatility indicators, the average true range indicator helps traders understand the way a currency pair moves. Moreover, the atr formula considers large ranges that accompany strong moves.
Any financial product moves in its own way. Stocks move differently than bonds, bond move differently than currency pairs…and so on.
Even among currency pairs, there’s a difference. Some range more. Others travel more.
The degree by which a currency pairs moves makes its volatility. Therefore, the volatility degree tells much about a currency pair.
For example, cross pairs are known for ranging most. They have a lower volatility degree than major pairs.
Because of that, traders approach them differently. They use different trading techniques based on the expected volatility degree.
In technical analysis, there were many attempts to “corner” volatility. For the stocks market, the volatility index is also called the “fear index”.
How come? The idea is that volatility is on the rise when negative news hit the wires.
Or, volatility increases when negative headlines appear. And, in doing that, it exceeds the volatility levels created by positive news.
However, things are different in the Forex market. When you talk about volatility indicators, you deal with ranges. So, the same notion, volatility, has different meanings for different markets.
This article aims to explain how to use average true range indicator in the Forex market. In doing that, we’ll cover:
- What is the average true range indicator
- The atr calculation
- Insights on the atr formula
- Other volatility indicators
- Pros and cons of using the average true range indicator
As usual, we’ll have plenty of practical examples. The idea is to fully understand this wonderful indicator. And, to make the most out of it.
What is the Average True Range Indicator?
Welles Wilder is best known for his work in technical analysis. He’s the father of many technical indicators famous today, like:
– the Relative Strength Index (RSI)
– the Average Directional Index (ADX)
– the Parabolic SAR
But, he also developed the average true range indicator. He basically covered all areas related to a price movement.
Any retail trader knows these indicators. They appear on any trading platform with the default settings.
As such, they’re popular. But, the average true range indicator is doing a bit more than a regular oscillator. It shows whether a break is for real. Moreover, it reinforces a trading decision.
It doesn’t provide an indication of price direction. Instead, it just gives an idea about its volatility.
Because of that, it can’t be used like the RSI. For example, traders look for the price and the RSI to diverge.
They buy or sell on bullish and bearish divergences. However, the atr indicator doesn’t show divergences.
The funny thing is that all the Wilder’s indicators were developed before the Personal Computer (PC) became available. But, somehow, they stood the test of time. Moreover, traders use them for different markets, with different outcomes. The Forex market is such a place.
Before continuing, it is worth noting that Wilder’s idea was to use the atr formula on daily prices. However, traders use other time frames too, for interpreting the start of a new move.
But why do traders use the average true range indicator? The answer is quite simple.
When traveling, a market may form large ranges. They show the commitment of traders to a direction or another.
Or, their enthusiasm. Large ranges suggest traders are ready to bid for higher prices. Or, lower ones, depending on the trend’s nature.
The True Range – the Starting Point for the ATR Formula
A volatility indicator measures the distance between two points. Not the direction.
We all know how to calculate the range of a trading day. Of any given trading day.
This is simple. Just make the difference between the high and the low.
That’s the range of a trading day. However, things get a little more complicated with the true range.
It effectively is the largest of the following prices:
- Absolute value of the most recent period’s high less the previous close
- Absolute value of the most recent period’s low less the previous close
- Most recent period’s high less its low
The key words for the atr Forex indicator are “absolute values”. Basically, they’re used to ensure positive numbers.
Understanding the ATR Formula
The average true range indicator calculates the current range. But, it uses past data.
As such, traders form an educated guess about the possible future prices. The atr formula doesn’t give predictions.
Instead, it offers a general idea about the market. It looks like this:
ATR = (Prior ATR*13) + Current True Range]/14.
In plain English, the atr formula multiplies the previous fourteen days average true ranges by thirteen. Next, it adds the most recent trading day’s true range. Finally, it divides the outcome by fourteen.
The MetaTrader offers the average true range indicator with the default settings. As such, there’s no need to import it as a custom indicator.
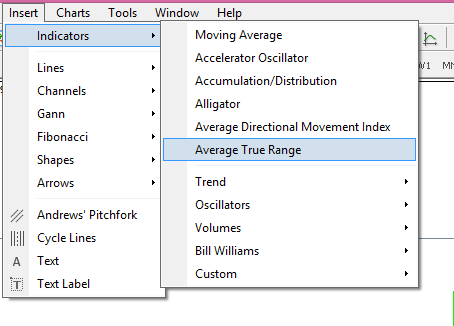
Typically, the atr mt4 indicator comes with the 14 as the default period. It effectively means it will consider the previous 14 days.
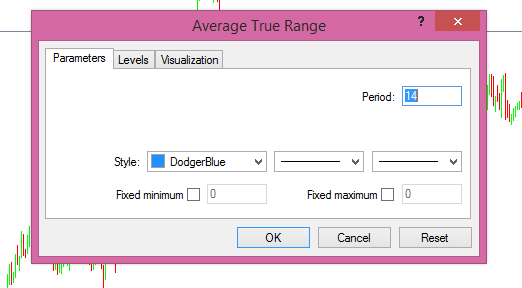
Of course, we can edit the input in any way we like. However, if the author used the 14-day period, it must be the best way to approach a market.
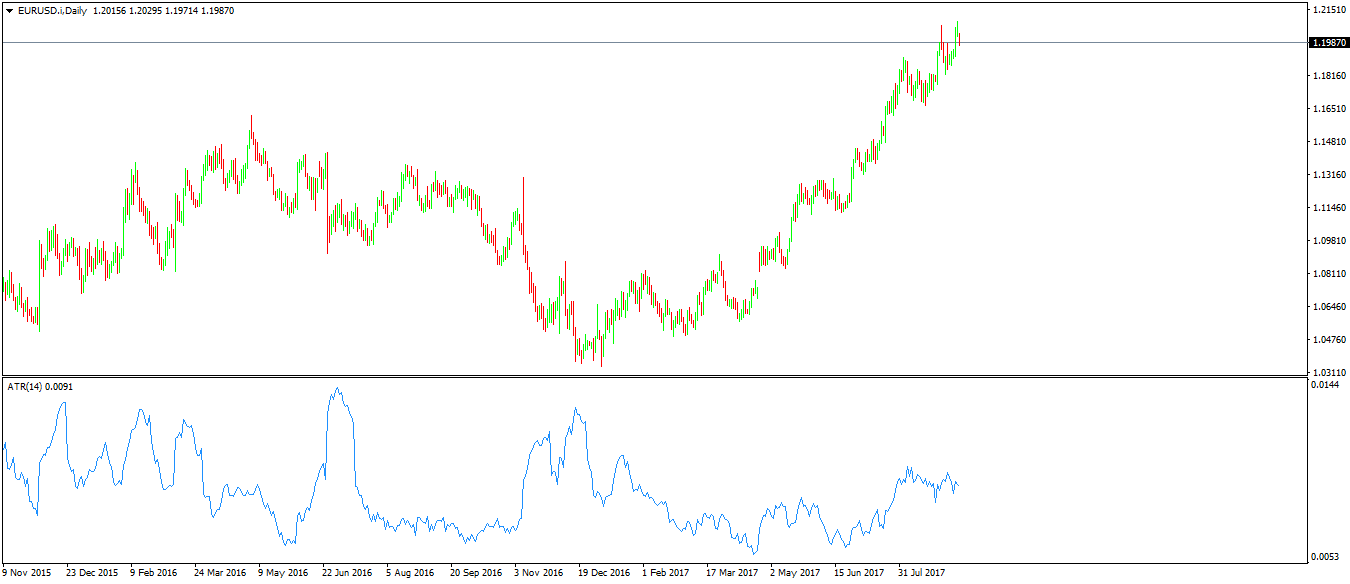
If we apply it on the daily chart, it’ll appear at its bottom. Yet, it isn’t an oscillator!
How to Use Average True Range Indicator
There are several ways to use the average true range indicator mt4 platform offers. The main use is to interpret a trend’s strength.
On top of it, the average true range indicator also serves as an element of position sizing. For example, a less volatile market leads to a larger trading position. Whereas a more volatile market has the opposite effect.
Support and Resistance with the Average True Range Indicator
When using the average true range indicator, Forez traders look at classical support and resistance levels.
For example, the market consolidates in a contracting triangle. And, the expected break is a bullish one.
Because of that, when the price breaks, traders go long. But, wouldn’t be nice to have a confirmation? Or, a reinforcement that the long trade is the right one? That the market doesn’t make a fake break?
This is what the atr formula is for. It gives a reinforcement that the break is for real.
Below is the EURUSD pair. It shows the pair forming a contracting triangle on the daily chart.
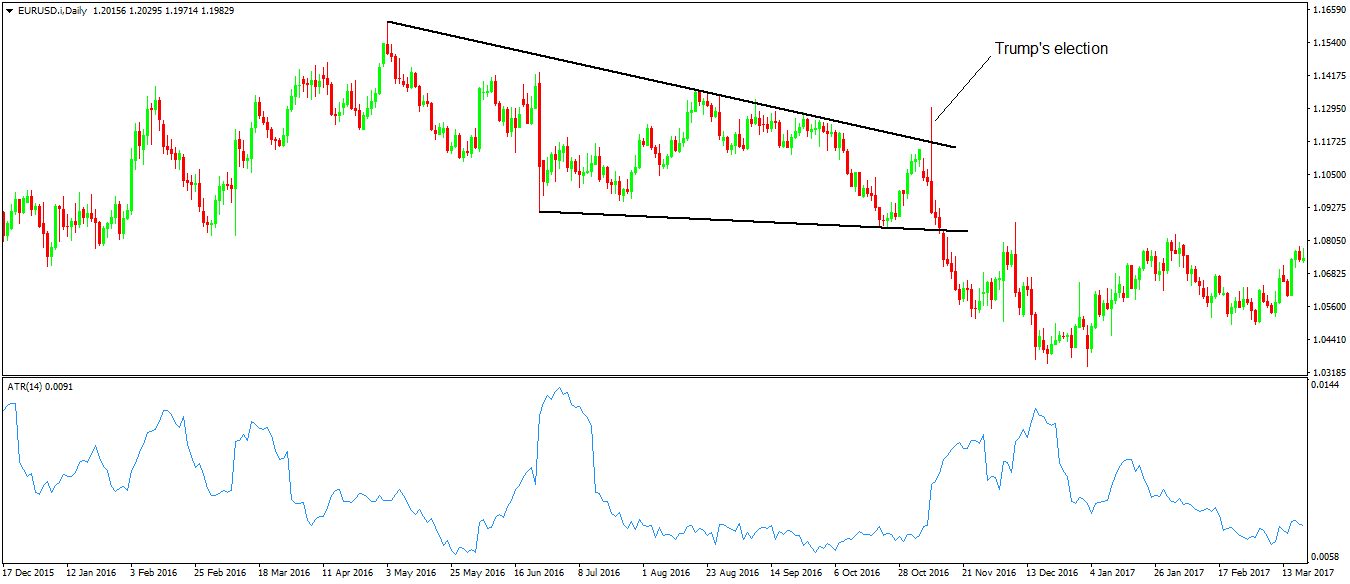
In a way, the consolidation was expected. The U.S. Presidential election was due.
As such, no one wanted to take any chance prior to its outcome. Traders simply waited patiently.
When ranging, the most common pattern the market forms is a triangle. In the foreign exchange market, a contracting triangle appears most of the times.
After the election day, the market broke lower. The so-called b-d trend line of the contracting triangle got broken.
Is there an indicator to reinforce this break? To confirm us that the break wasn’t a fake one?
The answer is yes. That’s one way to use the average true range indicator.
If the atr formula shows the range increases, it confirms the market started a new trend. Or, it shows the consolidation ended.
EURUSD Atr Trading Example
All traders know how to use support and resistance. However, they mostly interpret the levels on the actual price.
But, we can use the same technical analysis principle on the average true range indicator. The EURUSD chart below shows how.
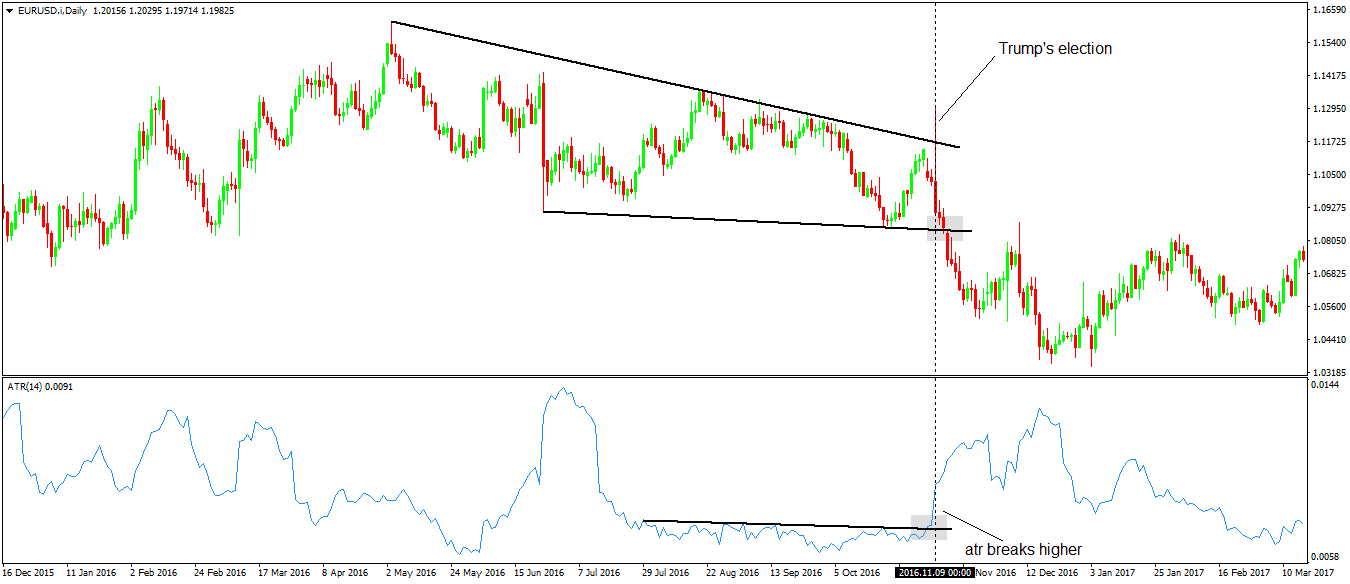
Prior to the U.S. Election, the EURUSD pair did move. However, the atr formula showed low values.
As such, the volatility simply wasn’t there. Despite the pair moving in a three-hundred pips range, it was just a range. Nothing else.
How do we know when the range will break? Moreover, how do we know if the break is real? And not a fake one?
Traders simply draw a trend line on the atr mt4 window. And, wait for the average true range indicator to break higher.
It doesn’t matter if the actual trend is bullish or bearish. If the volatility increases with a move, the chances are the move is for real.
In the EURUSD example from above, we see the ATR broke higher prior to the triangle breaking lower. As such, it was an earlier indication of the new bearish trend to come.
This way, the ATR broke resistance first. Next, the contracting triangle (the range) broke lower.
Therefore, we can say that the average true range indicator acted as a gauge for the new trend that started. After all, isn’t this what Forex traders want?
Hints from the ATR Indicator
The earlier example showed the atr formula confirming the triangle’s break. In fact, it acted as a trading signal.
The ATR broke the resistance before the triangle broke support. However, it is not the only way to use it.
How about taking some clues from the prior ATR evolution in the same pattern? For this, we need to get back to the EURUSD triangle.
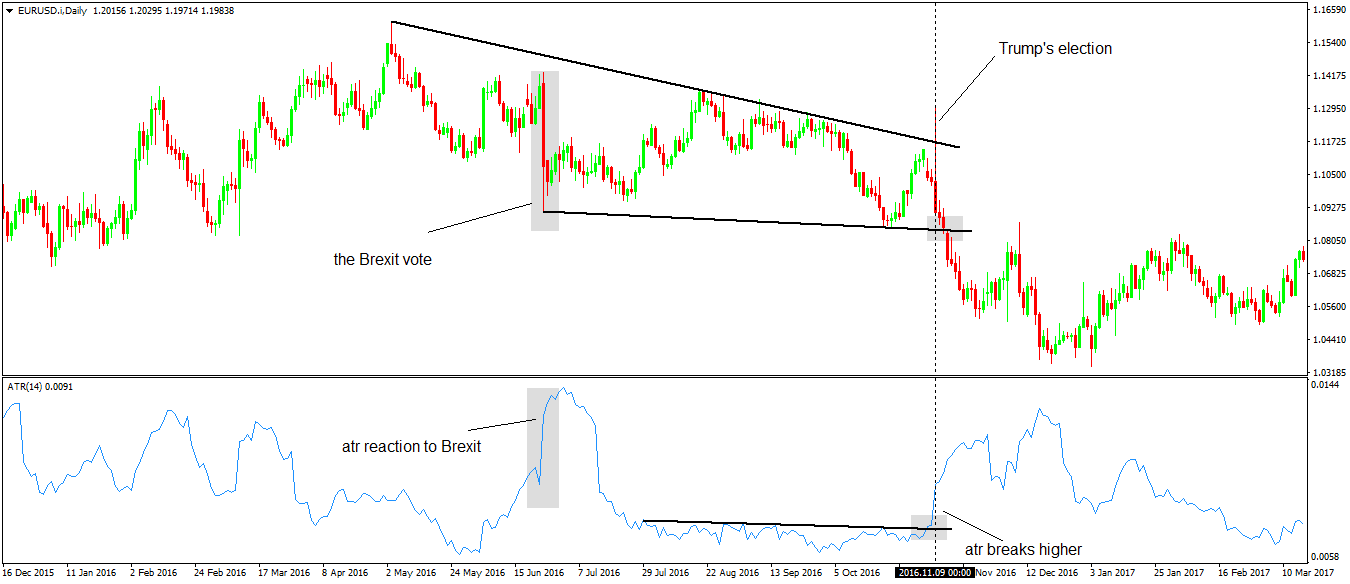
We see that within the triangle, the ATR broke higher with a bearish event. The Brexit vote.
In June 2016, the U.K. opted to leave the European Union. The referendum took many by surprise.
It caused jitters in the financial markets. Prior to it, however, the ATR had subdued values.
However, the reaction to the event gives a hint for the future price action. At that moment, the contracting triangle pattern wasn’t formed.
Traders didn’t know it will form. But, as time passed, the triangle became obvious.
Yet, the average true range indicator’s reaction to the Brexit vote was part of the triangle. Hence, the bearish Brexit reaction shows how the triangle will break.
Fast forward six months and the contracting triangle broke lower. The market simply took its time and ranged until the U.S. Presidential election.
Money Management with the Average True Range Indicator
So far, we showed two ways to use the atr formula. One for confirming a break. And, another one for having a hint of the future break.
In both cases, the information proved to be correct. The average true range indicator correctly told how the triangle would break.
Earlier it was mentioned that it works best on the daily chart. However, Forex traders use it on all time frames.
In a way, it makes sense. The intraday volatility has its peaks too.
Even during a trading week. Some days are more volatile than others.
For example, on Mondays and Tuesdays, ranges predominate. That is, most of the times.
However, starting with Wednesday, volatility is on the rise. It culminates on Thursday and Friday. The most important economic events come at the end of the week.
As such, all types of traders can use the average true range indicators. From scalpers to swing traders, everyone can integrate it in their system.
For the ATR offers great entries. Regardless of the time frame.
And, if traders can integrate it in a sound money management system, trading becomes profitable. A lot.
Atr Formula on Lower Time Frames
The following money management rules aren’t only for the lower time frames. However, if used on bigger ones, the stop loss gets bigger.
That’s the only difference. When looking for an ATR generated signal, traders use a simplistic approach.
First, the look for the market to start trending. That is, they look for a series of higher lows in a bullish trend. Or, lower highs in a bearish one.
Second, they buy when a market makes a new high. Of course, if the trend is bullish.
However, they buy only when the average true range indicator confirms the break.
Third, they place a stop loss at the previous swing. Finally, they use an appropriate risk-reward ratio.
A close check tells that these are the steps part of any money management system. Only this time the atr formula comes to help.
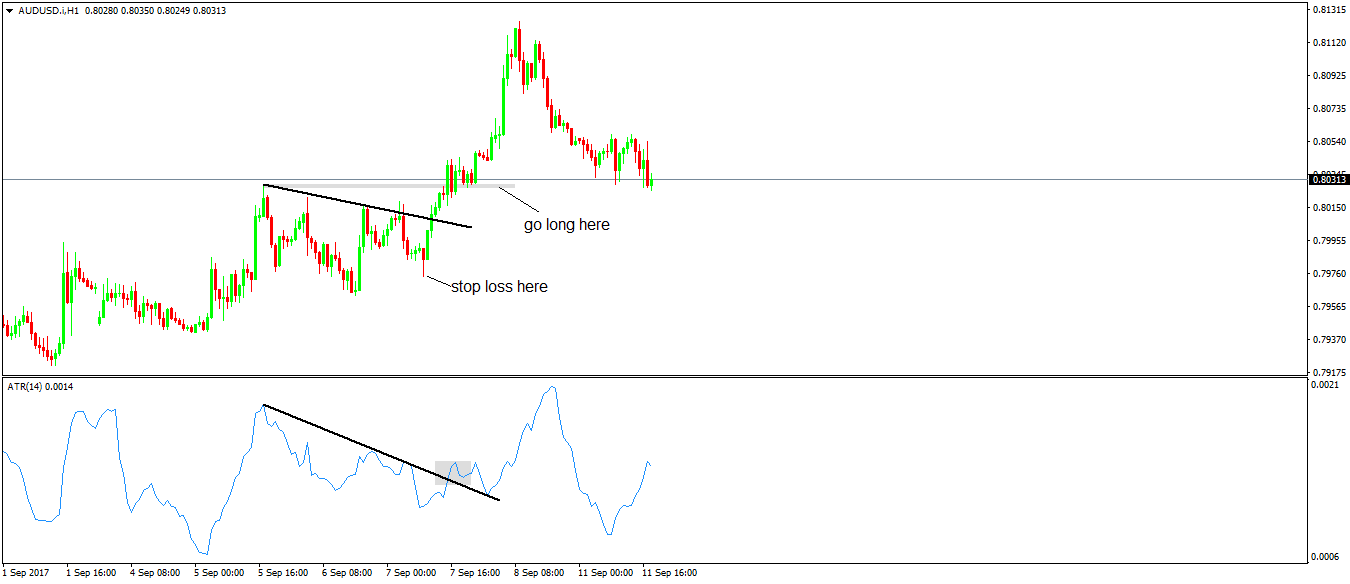
The AUDUSD hourly chart above shows how to trade with the atr formula. The pair started to drift higher.
It already made two higher lows. As such, the idea is to buy a new high. However, only when the ATR breaks higher too.
Simply wait for the market to make a new high when compared with the previous swing. Next, check the ATR for confirmation.
If the new high comes with higher ATR, go long with a stop at the previous lows. Finally, use a proper risk-reward ratio.
In the case above, the average true range confirmation comes a bit late. However, for intraday trading, the atr formula confirmed the break higher.
Other Volatility Indicators
The average true range indicator is not the only volatility indicator. The following have the same function:
- Chaikin’s Volatility
- Donkian Channel
- Volatility Quality Index
- Normalized Average True Range
However, what matters for Forex traders is to understand how to treat volatility. All of the above reinforce a potential market move.
Even classic indicators used for other purposes, hint at volatility changes. The famous Bollinger Bands indicator is one.
When the two bands contract, this happens before a break. Or, before the volatility to rise.
As such, it can be used to measure future volatility. The narrow the distance, the more powerful the break to come.
This is just an example to illustrate how to spot volatility. In this case, too, traders know that a break will come. However, they won’t know the direction.
Pros and Cons of the Average True Range Indicator
Volatility can’t stay low forever. That’s the starting point to any trading strategy surrounding it.
A break from lower levels alerts traders about a possible strong move to come. That’s the main advantage of using the atr formula.
On the downside, it is a subjective indicator. It doesn’t show potential reversals. Nor trend continuation.
On top of it, most of the times it lags. As such, the potential reaction comes late.
Conclusion
The average true range indicator is a versatile tool. It can be used to confirm entries. And, to confirm breaks.
However, it doesn’t indicate direction. As such, it rises and falls both in uptrends and down trends.
One of the examples used here showed the atr formula catching the very beginning of a trend. In reality, this seldom happens.
Most of the times, it won’t catch the very beginning or end of a new move. But, even late entries prove to be valuable.
It merely shows the degree of interest in a move. Or, disinterest.
Large ranges accompany big moves. This is not something new. Major trading theories treated this concept too.
For example, the Elliott Waves Theory states that for every big move (impulsive wave) the market has two ranges. The two corrective waves.
An indicator like the average true range indicator helps to identify them. Volatility will decrease significantly.
When the new wave starts again, volatility will pick up. The atr formula will print higher values.
This way, traders use the indicator to check the previous analysis. In fact, this is why it was created in the first place.
Traders use various technical analysis concepts to forecast future prices. Then, if they need a tool to confirm a setup, the average true range indicator will do the trick.
