Support and resistance are the basis of price action trading. Part of any technical analysis 101 course, every trader goes through them.
Moreover, throughout a trader’s life, both price action and support and resistance levels will follow his/her analysis. And, for a good reason.
They’re reliable, rarely give false signals, and keep the trader on the right side of the market. What more to ask?
Support and resistance in Forex trading is a unique concept. First applied as part of the stock market geometry, it fascinated traders with its accuracy.
If you want, it is one of the few technical analysis principles that projects human behavior. Or, crowd behavior.
Price action trading is a concept that refers to trading with a naked chart. More precisely, merely looking at price action and deciding if the market is bullish or bearish.
However, some basic technical analysis tools do help. And, they mix with support and resistance to find even better trades.
But this is more about basic tools, like:
- trendlines
- channels
- classic technical analysis patterns
In this article, we’ll use plenty of examples to:
- show how to draw support and resistance levels
- how many types of support and resistance levels exist
- market geometry when projecting levels
- explain what is price action
Above all, we’ll cover naked charts and build on the price action that followed, using logic and technical analysis alone. Furthermore, we’ll project levels with explicit entry, exit and take profit, following money management rules.
In the end, we’ll mix support and resistance with essential price action trading to prove:
- the classic technical analysis does work in Forex trading
- naked charts do show a clear picture
- a chart tells a thousand words in technical analysis
Support and Resistance in Price Action Trading
As mentioned earlier, this article deals with examples. Plenty of them.
Moreover, we’ll start with the very basic stuff: price action. But, we just said price action deals with interpreting a naked chart. Hence, that’ll be the starting point.
Before beginning, we should mention something about technical analysis. It deals with projecting levels from the left side of the chart into the unknown. Or, the right side of it.
Some basic technical analysis concepts we’ll use:
- for a trendline, we only need two points
- when support and resistance forms horizontally, we project classic levels
- when not, it is dynamic, or progressive
- between the two, dynamic levels work better
- the more the price will test a trendline, the weaker the support and resistance becomes
- once broken, support turns into resistance
- when resistance fails, that level turns into support for future price action
In any case, many of these concepts you are familiar with already. Because we used them in pretty much every technical article, they shouldn’t come as new stuff.
However, the application on a naked chart or interpreting pure price action differs.
The approach deals more with a logical process, rather than a technical theory. Hence, we need to build the logical process in such a way at the end of the article no stone remains unturned.
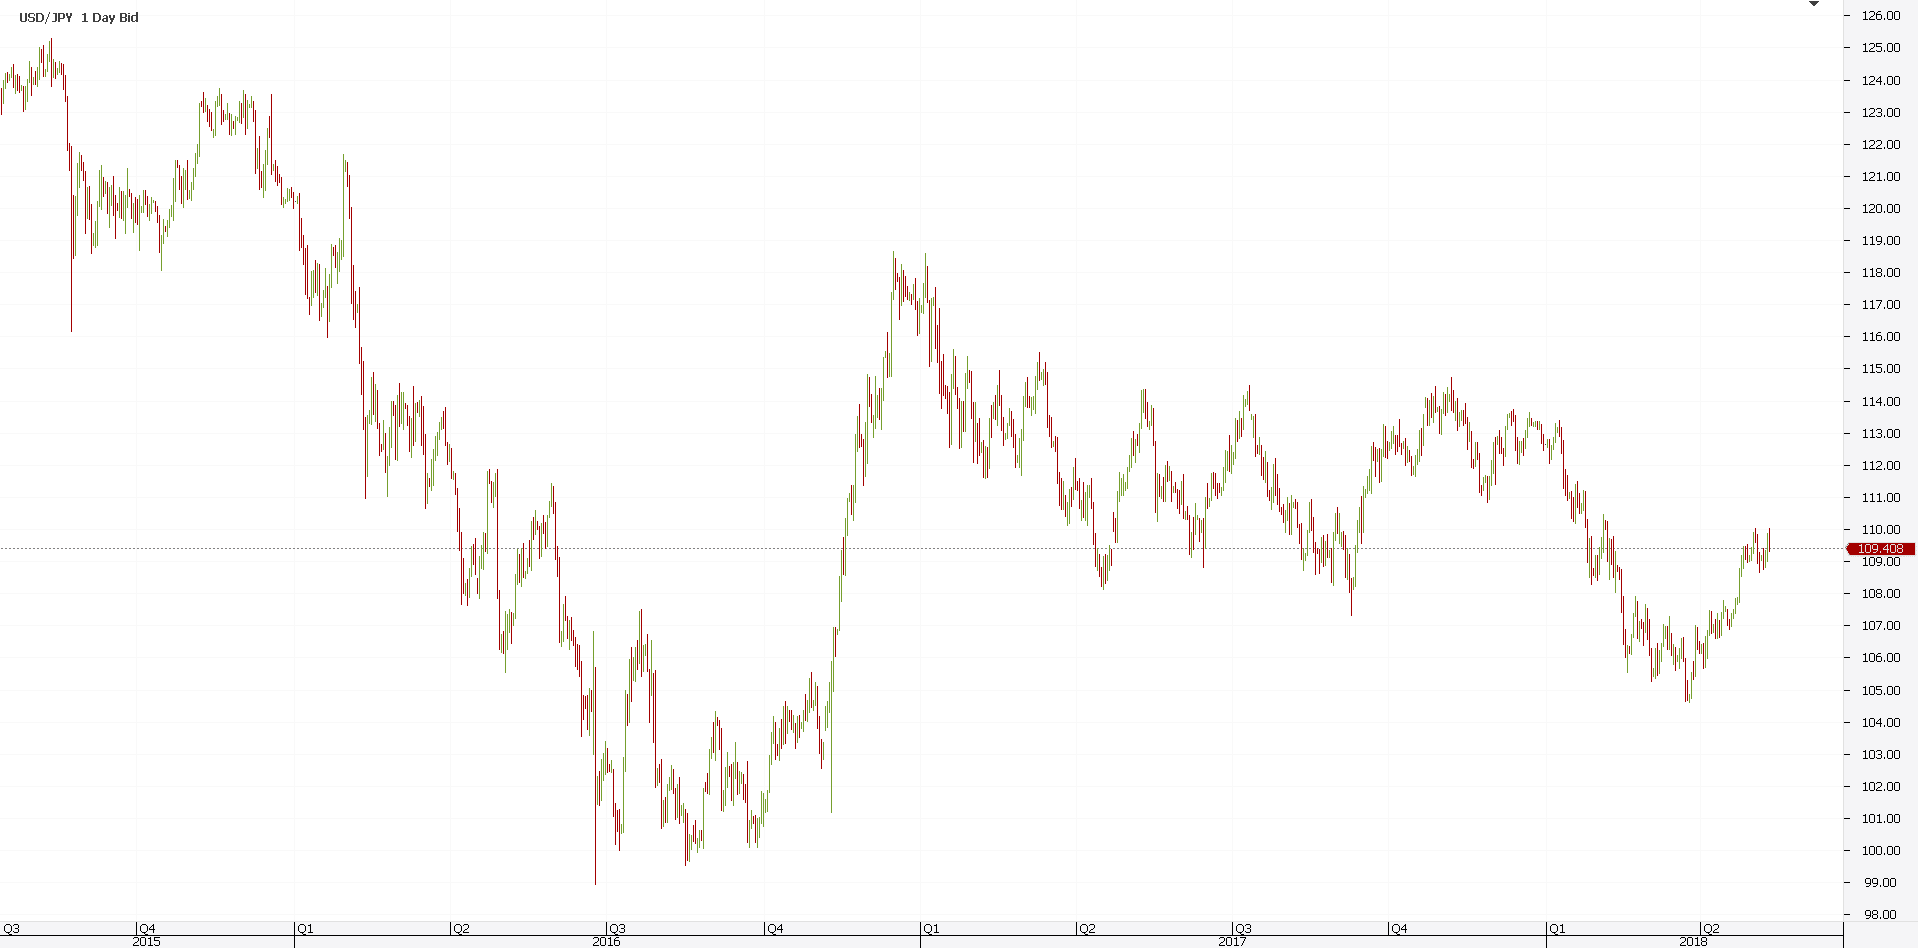
As already mentioned, we’ll start from a naked chart. In this case, we use one of the most popular trading pairs in the Forex market: the USDJPY.
As for the timeframe, this is the daily chart. Therefore, every candle, green or red, represents a trading day.
Price Action Trading Strategies Starting from a Naked Chart
The USDJPY chart above shows the drop from 125 to 100. It came quite fast, in less than a year, taking many by surprise.
However, for the price action trader, it was a gift from the skies. Fast-moving markets are the bread and butter of any speculator.
No moves, no profits. Who wants that when trading?
The sudden drop on the top left of the chart has a story. An ugly one!
The so-called flash crash happened in a few minutes. The DJIA in the States fell so abruptly that USDJPY dipped hundreds of pips too.
A flash-crash trigger stops, panic and more stops. Finally, the dust settles, and traders look at the damage.
For a seven-hundred pips move, it happens fast. But, the spike that followed didn’t take the previous highs.
Instead, it tried to break lower again. However, failed lamentably.
Moreover, it made a higher low, enough for traders to draw a trendline. Remember what is price action: trading without indicators or trading theories. Trendlines and support and resistance are all one needs.
Go back here at the concepts we said we’ll use. One of the best indicators is a trendline. And, for it, we need two points. But, we already have them: the flash-crash low and the higher low.
Hence, we can connect them and drag the trendline. What for?
To find out future support and resistance! Based on previous price action, we find future support and resistance.
How cool is that? Furthermore, keep in mind that we know nothing about the future price action to come.
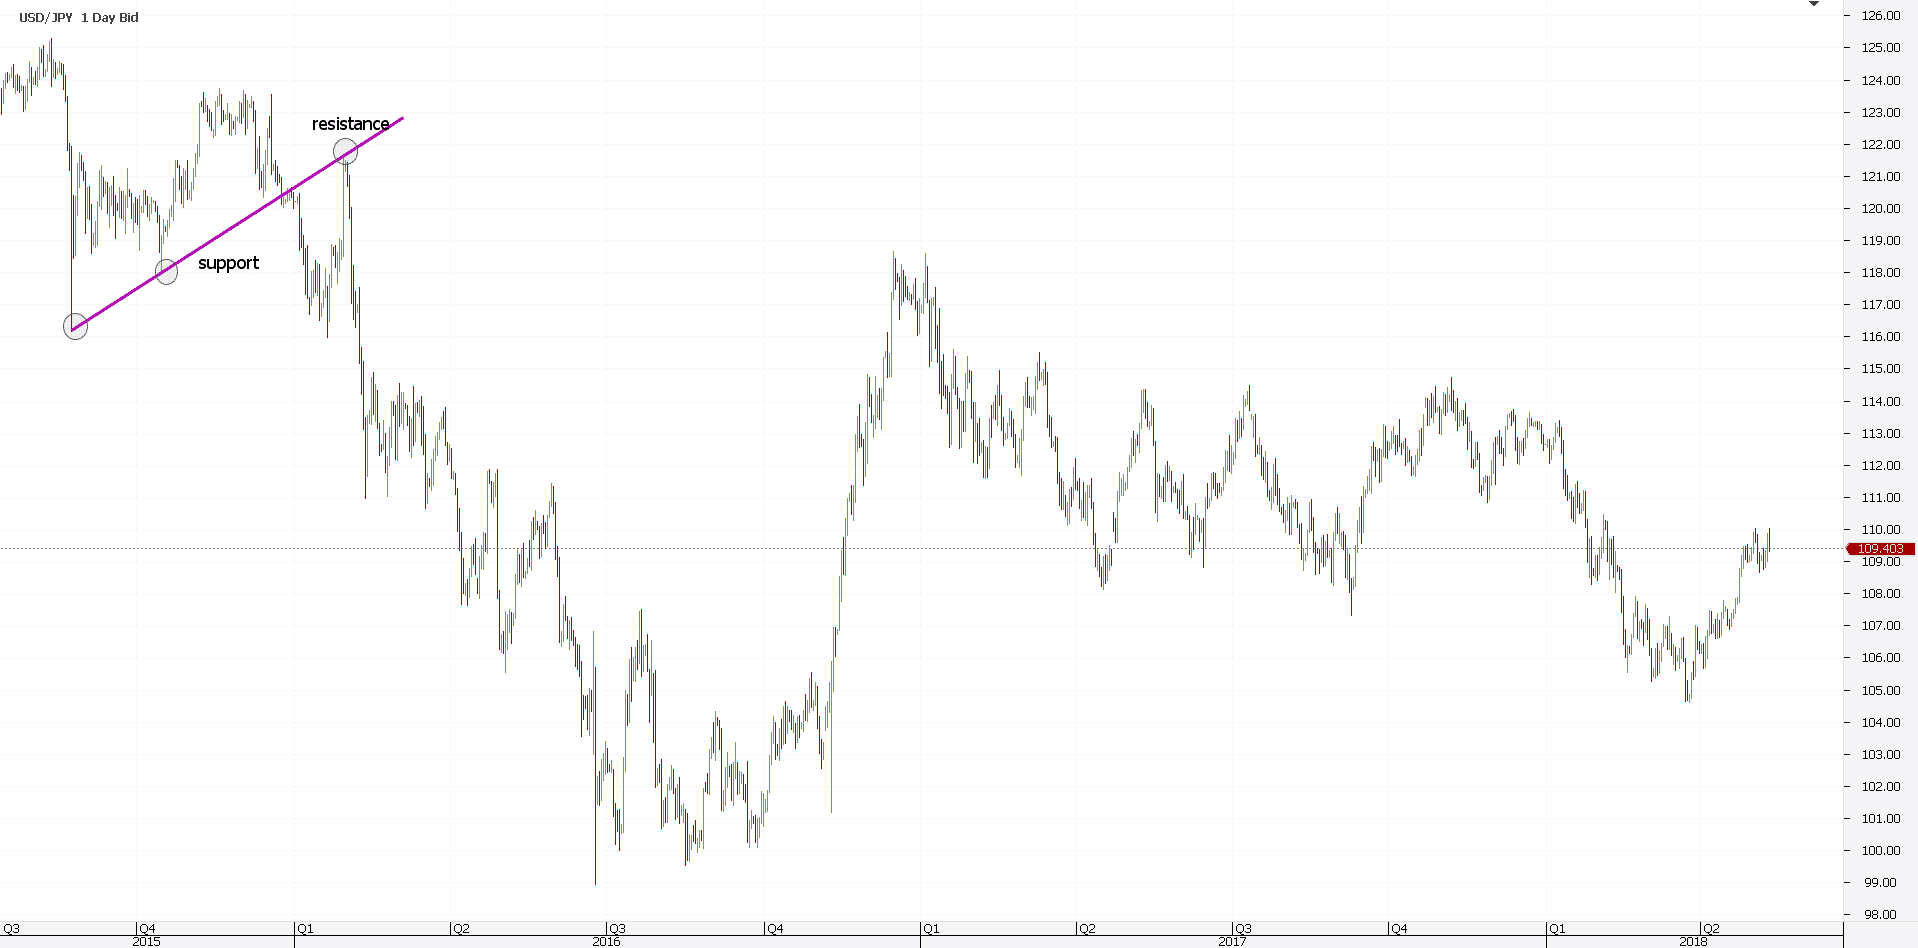
A quick review: that’s dynamic support, turned into resistance. Dynamic, because it isn’t horizontal.
And, resistance gives a great trade:
- entry – at resistance
- stop loss – at the previous high
- take profit – 1:3 rr ratio
Projecting Classic and Dynamic Support and Resistance
While not a Forex indicator, a classic and dynamic level is more accurate. First, it leaves no room for error.
Second, even if it does, the rr ratio allows embracing a few losses. Finally, it keeps the chart clean, and trading moves with the price.
Continuing with the price guide on the USDJPY chart, we see a sharp reversal. Right from the dynamic resistance, the price action Forex traders see is super-bearish.
In fact, almost vertical, reminding everyone of the flash-crash. However, in the race to move lower, the bearish price action broke classic support. We did have two horizontal points to draw such a level. Right?
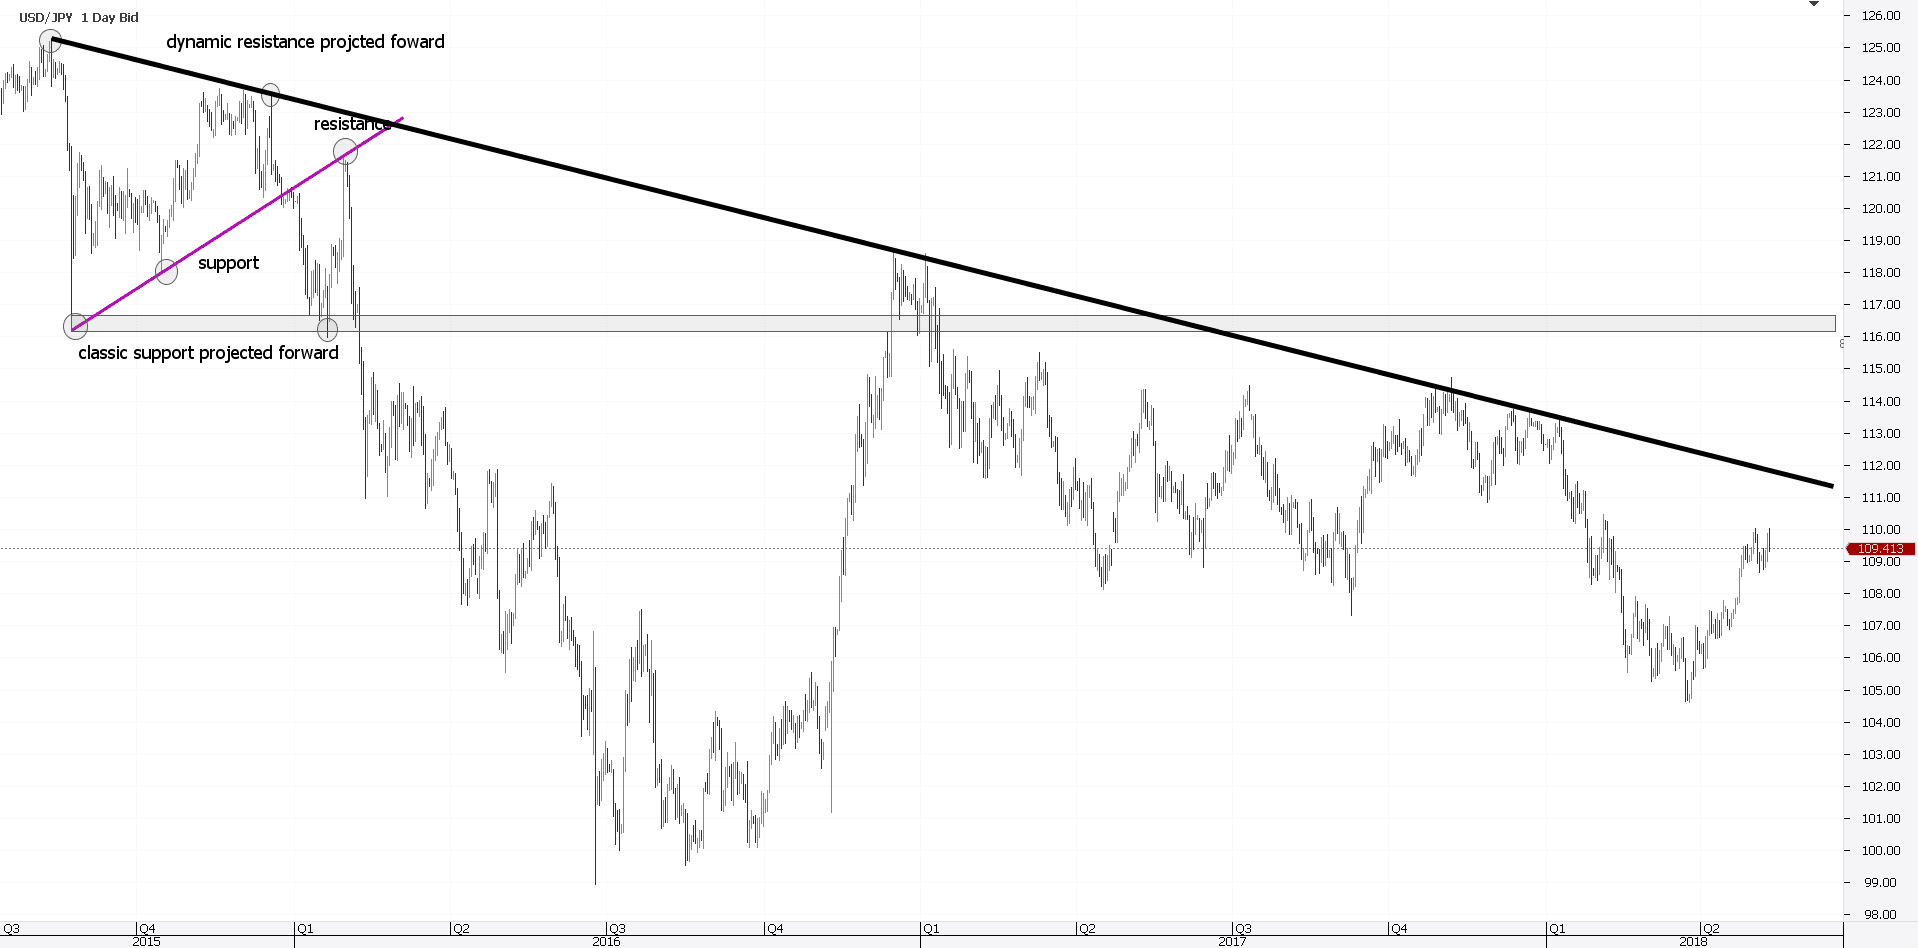
That level, or area, we project on the right side of the chart. Again: price action to follow is not known at this point.
It is not the best indicator that the price will turn in the future. However, it gives us a pretty good idea where at least it might hesitate.
Let’s remain on this top left corner of the chart. We’re not done yet!
Now that we had two points to project future classic support and resistance is that all?
Of course, not. How about dynamic price action levels?
These support and resistance lines should follow any technical analysis setup. And, any chart on any timeframe!
Ever wondered how to calculate support and resistance? In the case of classic levels, all is clear now. We already projected the area on the right side of the chart.
For dynamic levels, traders use the series of:
- lower highs and lower lows in bearish trends
- higher highs and higher lows in bullish ones
Hence, the market fell with the flash crash. Next, it bounced, without making a new high. Finally, it broke. That’s all we need to project the black trendline.
Confluence Support and Resistance Areas
So far, we projected levels on the right side of the chart. And, we did that, from an area on the top left of the chart.
In fact, we used the price action of about two quarters of a year. Next, we defined the classic and dynamic support and resistance. Finally, we project the levels on the right side.
Again, we don’t know what’s about to come. We merely projected the levels.
When two or more technical factors meet in the same area, that’s difficult to break. Called a confluence area, it represents the point to break.
In the USDJPY case, we’ve projected classic and dynamic support and resistance. And, both derived from pure price action.
Hence, a confluence area is one that has both classic and dynamic levels. Just like the chart below shows.
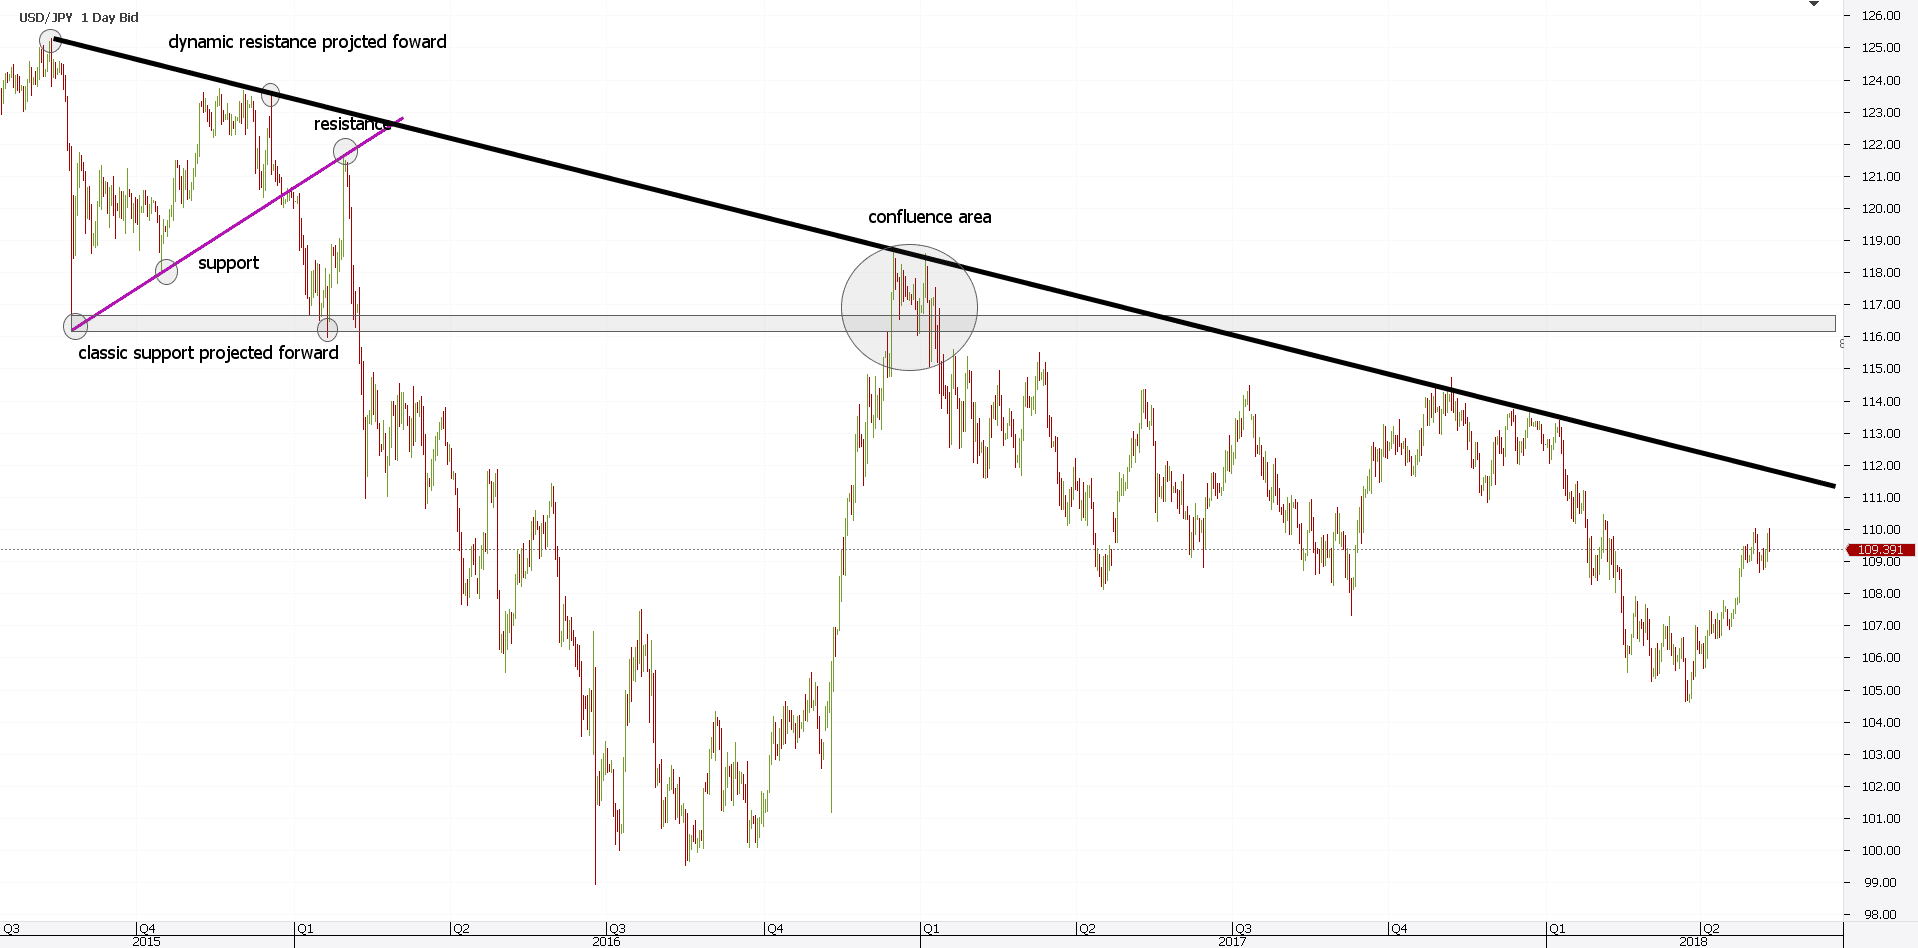
We see the pair dropped like a rock to the 100 level. In Forex trading, that’s a lot.
More than twenty-five big figures in a year dominated by two main events: the Brexit vote and the U.S. Presidential elections.
The Brexit vote caused the 100 level to reach. And, the Trump’s election sparked the rally that followed to the confluence area.
Mostly because of Trump’s agenda, investors realized the outcome is, in fact, bullish for stocks. After the initial pullback meant to trigger some more stops, the pair blasted higher.
In an almost vertical rise, the pair ended 2016 at the confluence area. What could go wrong?
The U.S. equities, a significant driver on the USDJPY pair, sat at all-time highs. Why not USDJPY continuing the ride?
As it turned out, stocks did continue higher. Not the USDJPY, though.
The confluence area was too much. And, price action traders using support and resistance levels new that also!
Building a Channel Derived from Price Action
As the USDJPY chart shows, the price reversed. Hardly!
Here’s how to trade the confluence area:
- entry – wait for the market to fall below the classic resistance
- stop loss – at the confluence area’s high
- take profit – 1:3 rr ratio
Not only that it reversed, but one year later, it still sits below the dynamic levels defined at the end of 2015.
Until the price can break that level (the black line in the previous chart), the price action remains bearish.
However, remember one of the classic technical analysis principles. It was mentioned at the start of the article: the more the price tests a level, the higher the chance it’ll break it.
For this reason, we can consider the confluence area as the first time the market tested the dynamic level. At that moment, we didn’t know it’ll test it again, as we know now.
Traders only saw a rejection. But how much it’ll fall?
Is there a way to project a level to anticipate support? Yes, there is.
Here’s how to calculate it. First, use the dominant trendline. The black one.
Second, copy and paste it from the first low in the bearish downtrend.
Finally, use the projected levels as dynamic support for the price action to come.
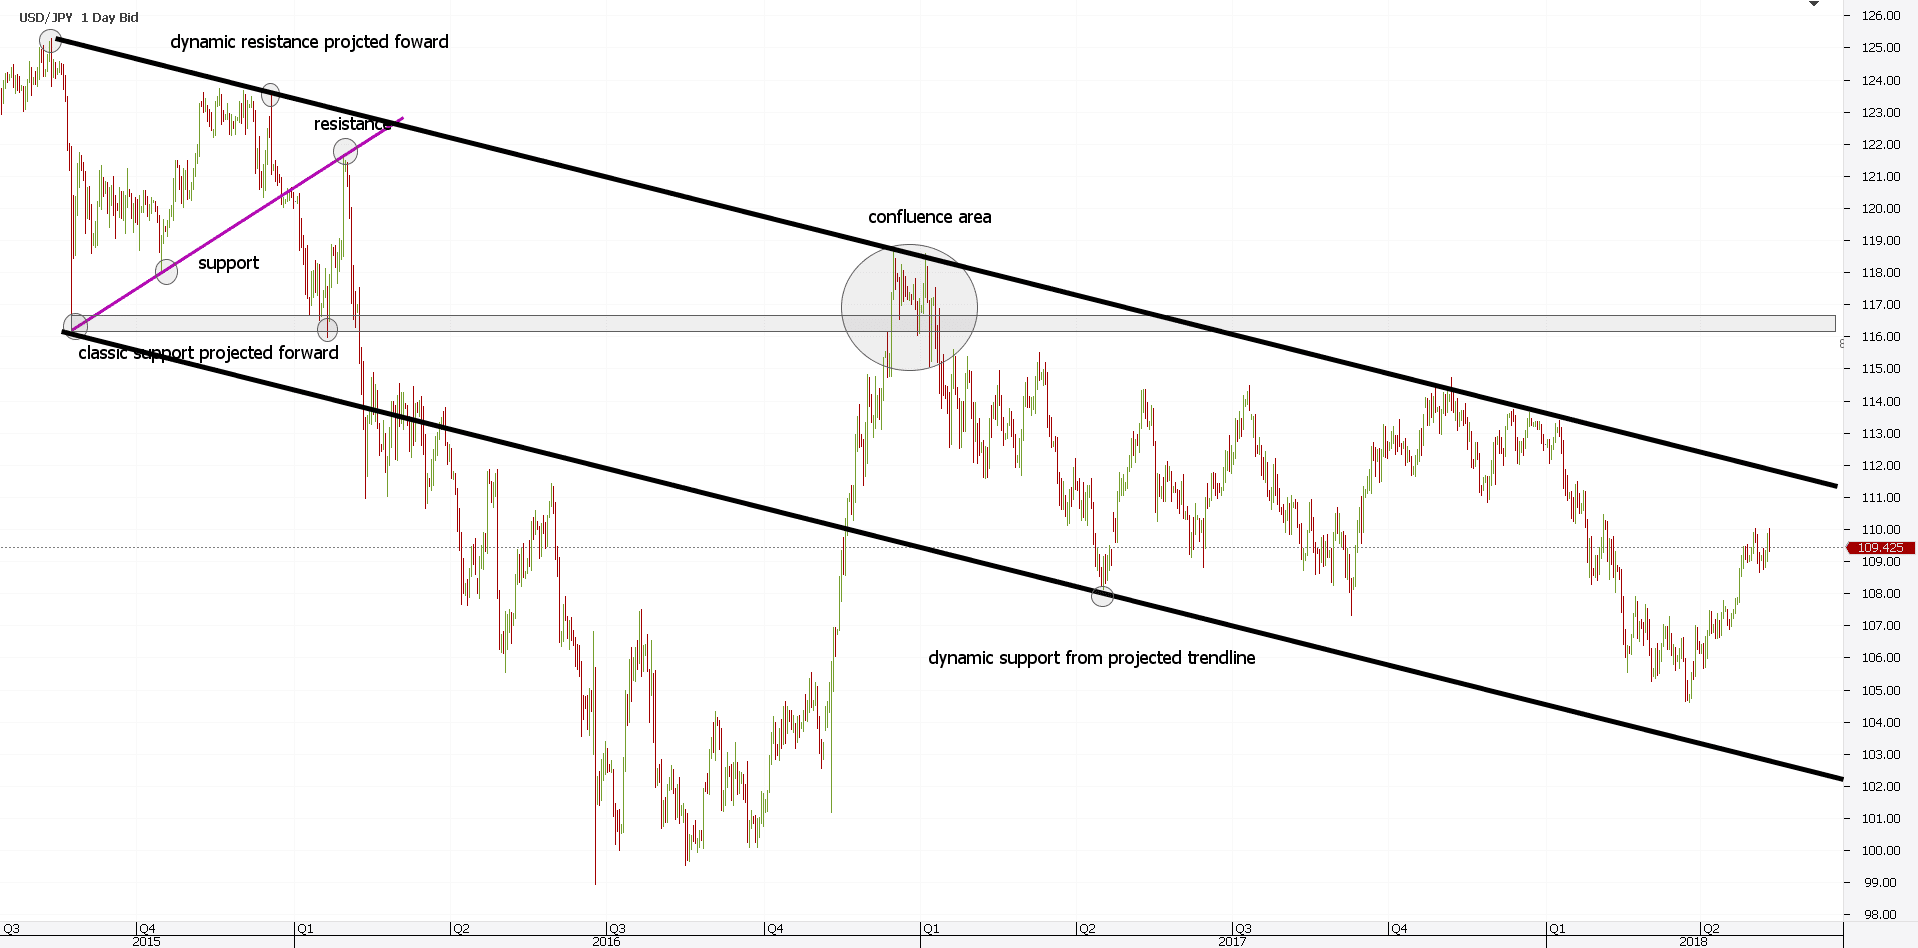
As it turned out, the price action strategy proved accurate almost by the pip. Who needs trading algorithms and sophisticated strategies when simple trendlines work?
Simple things always work, and price action is here to show us how. Savvy traders knew how to project the primary trendline more than four months before it happened. And, they did.
Classic Technical Analysis Patterns with Support and Resistance Areas
We must go back to what price action means: no indicators or trading theories of any kind. However, a few classic technical analysis patterns won’t hurt.
That is especially true if they come to reinforce the original trading idea.
The thing is to look for them against support or resistance levels. Even better, against confluence areas.
Next, trade them for the measured move they bring. We all know by now that double tops and bottoms, triangles, and head and shoulders have a measured move.
In a way, it is like Forex price action scalping, because you’ll be in the trade for the shorter move. However, why not? If the pattern and trade make sense, traders shouldn’t ignore a setup.
Double Top with Price Action Confirmation
Remember the earlier confluence area? Let’s review it a bit: it had a classic and dynamic resistance. Excellent! By all standards, enough for a trade.
However, if more elements point to the same direction, it further confirms the strength of the area. And in this case, the market formed a double top.
Before displaying the chart, let’s review what a double top is. It forms when:
- the market hesitates at around the same horizontal area
- effectively, it meets resistance
- the price reverses
- the pattern resembles the letter M
See anything familiar in the confluence area below?
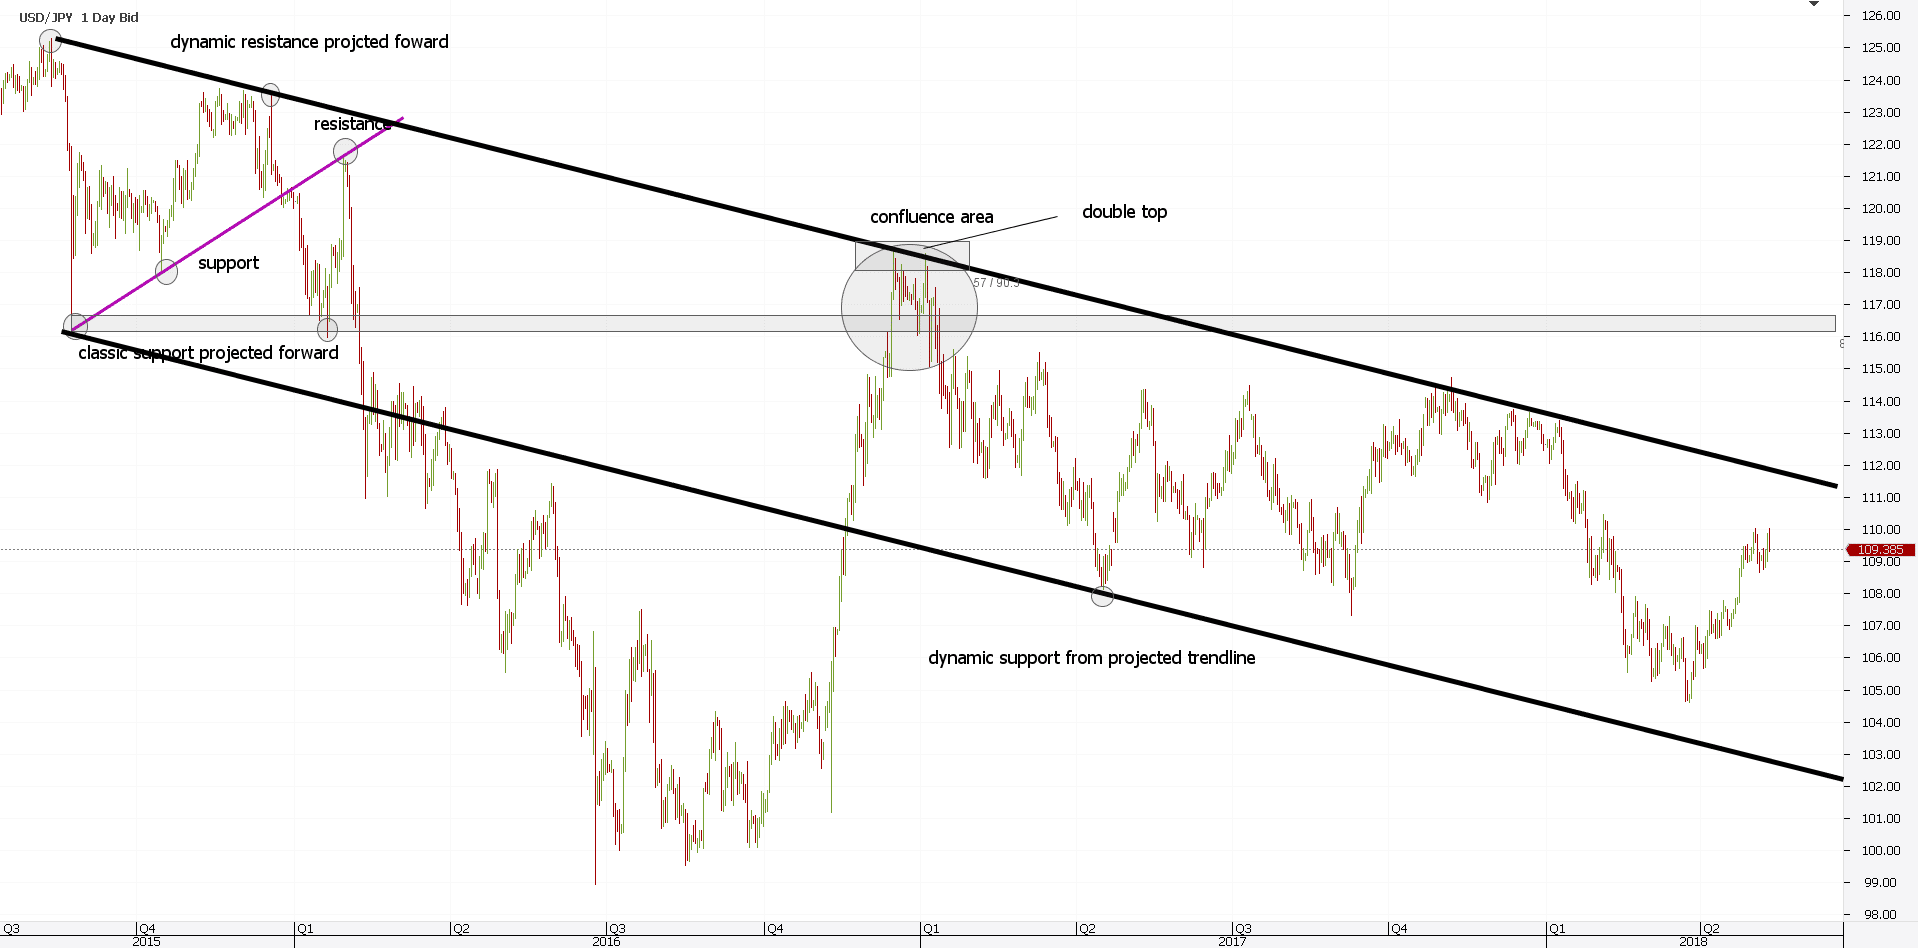
On the move higher, not only that the market met the original confluence area. But right there, it formed a double top.
Or, a reversal pattern. Against two resistance factors, the third one comes to give yet another confirmation that this is no way for the price to break higher.
Triangle as a Reversal Against Dynamic Support and Resistance
So, the USDJPY dipped into the dynamic support given by the projected main trendline (the black one). How much is too much on the long side?
How would traders know if the price action is enough to break the upper side of the bearish channel?
The truth is that no one knows. We merely need to sit and wait what the price will do at the dynamic resistance.
And, in this case, it formed another reversal pattern. Only this time, instead of a double top, it created a triangle as a reversal pattern.
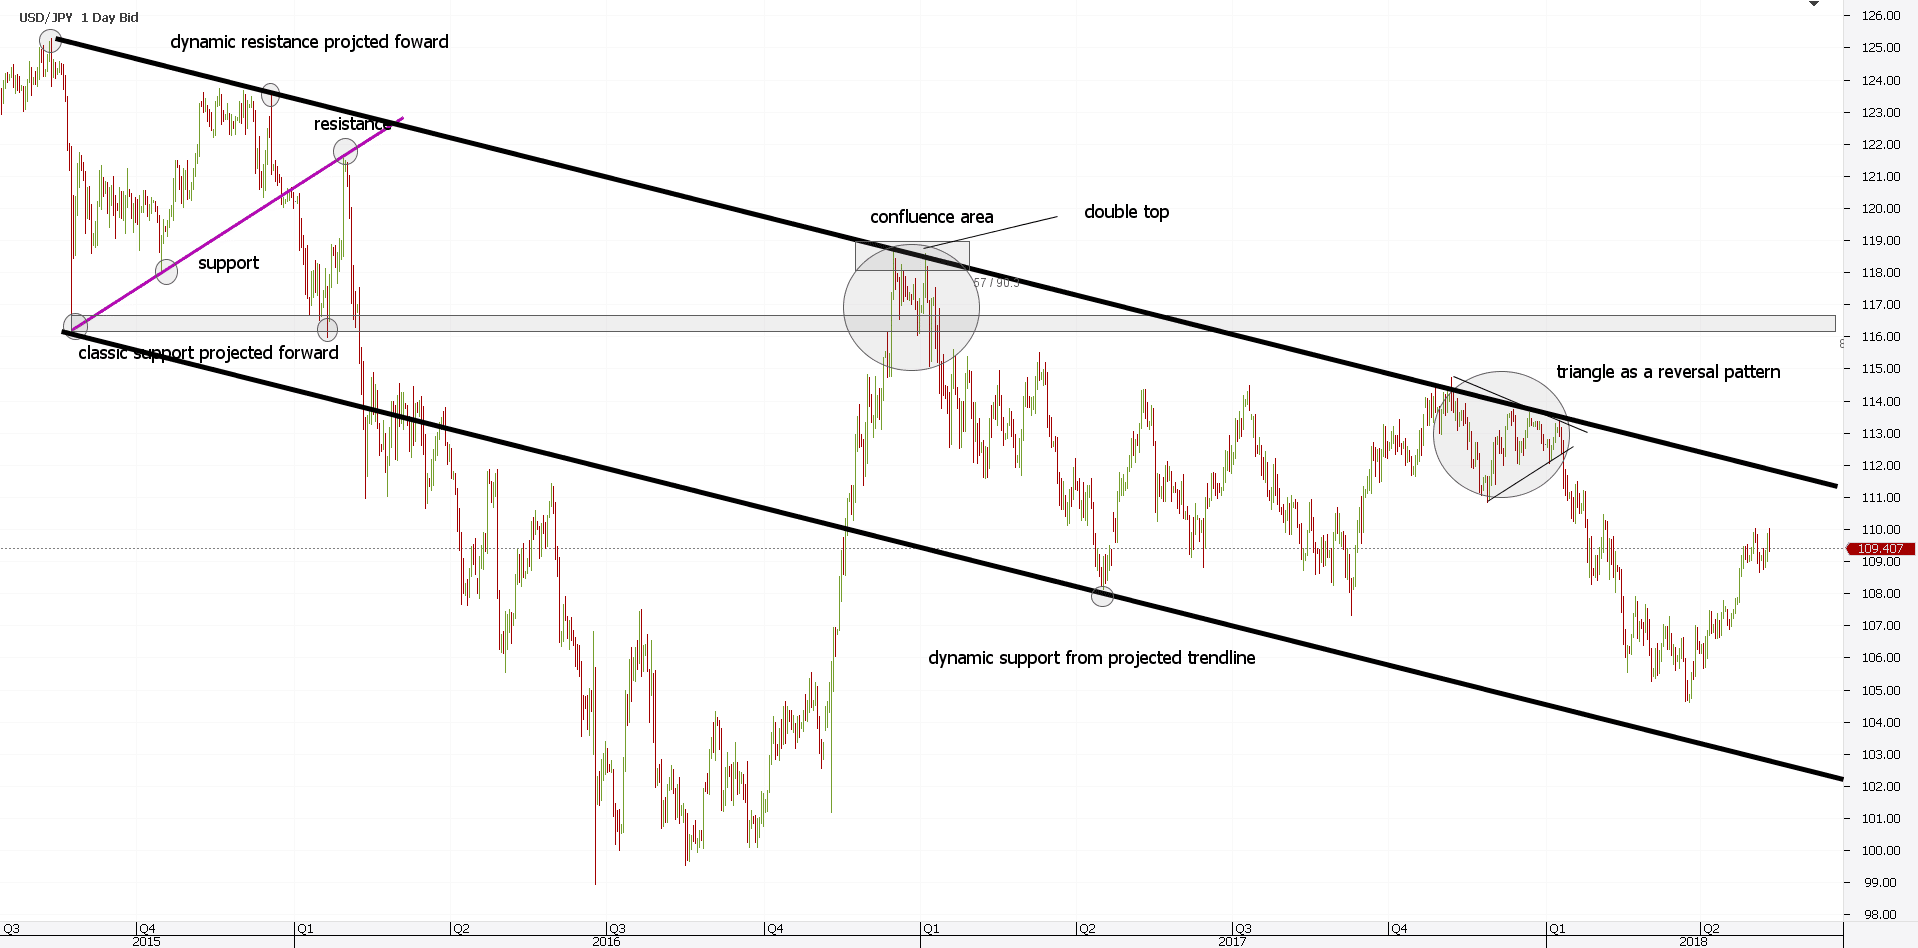
By now, you know that the triangle against dynamic resistance forms a confluence area. Hence, bearish price action should follow. Not bullish.
For this reason, closing the eventual open long positions makes sense. And, traders can even speculate on the bearish triangle, trading it for the measured move.
What Next from a Price Action Point of View?
Step away from the chart. Or screen.
Leave some distance and picture the entire setup. What did we say at the start of this article?
The more the price comes to the support or resistance level, the weaker this one becomes.
In this case, the price action already hit dynamic resistance twice. If it comes for the third time, bull better watch for a break.
Moreover, recheck the chart. What do we see?
A bearish channel, the price dips lower, and a quick retracement follows. Next, a consolidation forms.
In any technical trader’s book, the pattern resembles a head and shoulders. Hence, a break at the dynamic resistance implies a quick run to the horizontal resistance level already projected.
Isn’t price action interesting?
Conclusion
Price action trading using support and resistance levels works fine on all charts. And, all timeframes.
However, more significant timeframes give more exact scenarios. Because trading algorithms influence price action, many traders look for shelter on the more significant timeframes.
Some traders use a support and resistance indicator mt4 platform allows, to project these levels. But, with all due respect, no indicator can replicate the logical process we’ve built during this article.
We started from the left side of a current chart. Next, we defined the conditions for the price action setup.
Forward, we projected the classic and dynamic support and resistance levels. Moreover, we used traditional technical analysis patterns to profit some more.
Finally, we look at the price action to see if it’ll invalidate the primary trendline.
And, all this, using:
- common sense
- basic technical analysis
- classic patterns
- trendlines and projected levels
To sum up, it is easy imagining that a currency pair will move thousands and thousands of pips in a straight line. The reality, however, tells us the opposite.
It tells us that is possible! But, only if support and resistance breaks. And, you’ll know that beforehand. Price action will tell you!
