NZD/JPY started to produce lower lows and lower highs, suggesting the validity of the downtrend. Besides, price broke below the average price uptrend trendline as well as 50 Simple and 200 Exponential Moving Average.
Disclaimer: The analysis presented in this article is for educational purposes only and should not be considered as financial advice.
This analysis was done on MetaTrader 4.
Click below to open a Free Demo Account with our trusted brokers:
Analysis Details:
NZD/JPY symbol on the MT4 platform
Type: Bearish
Key support levels: 69.89
Key resistance levels:71.20
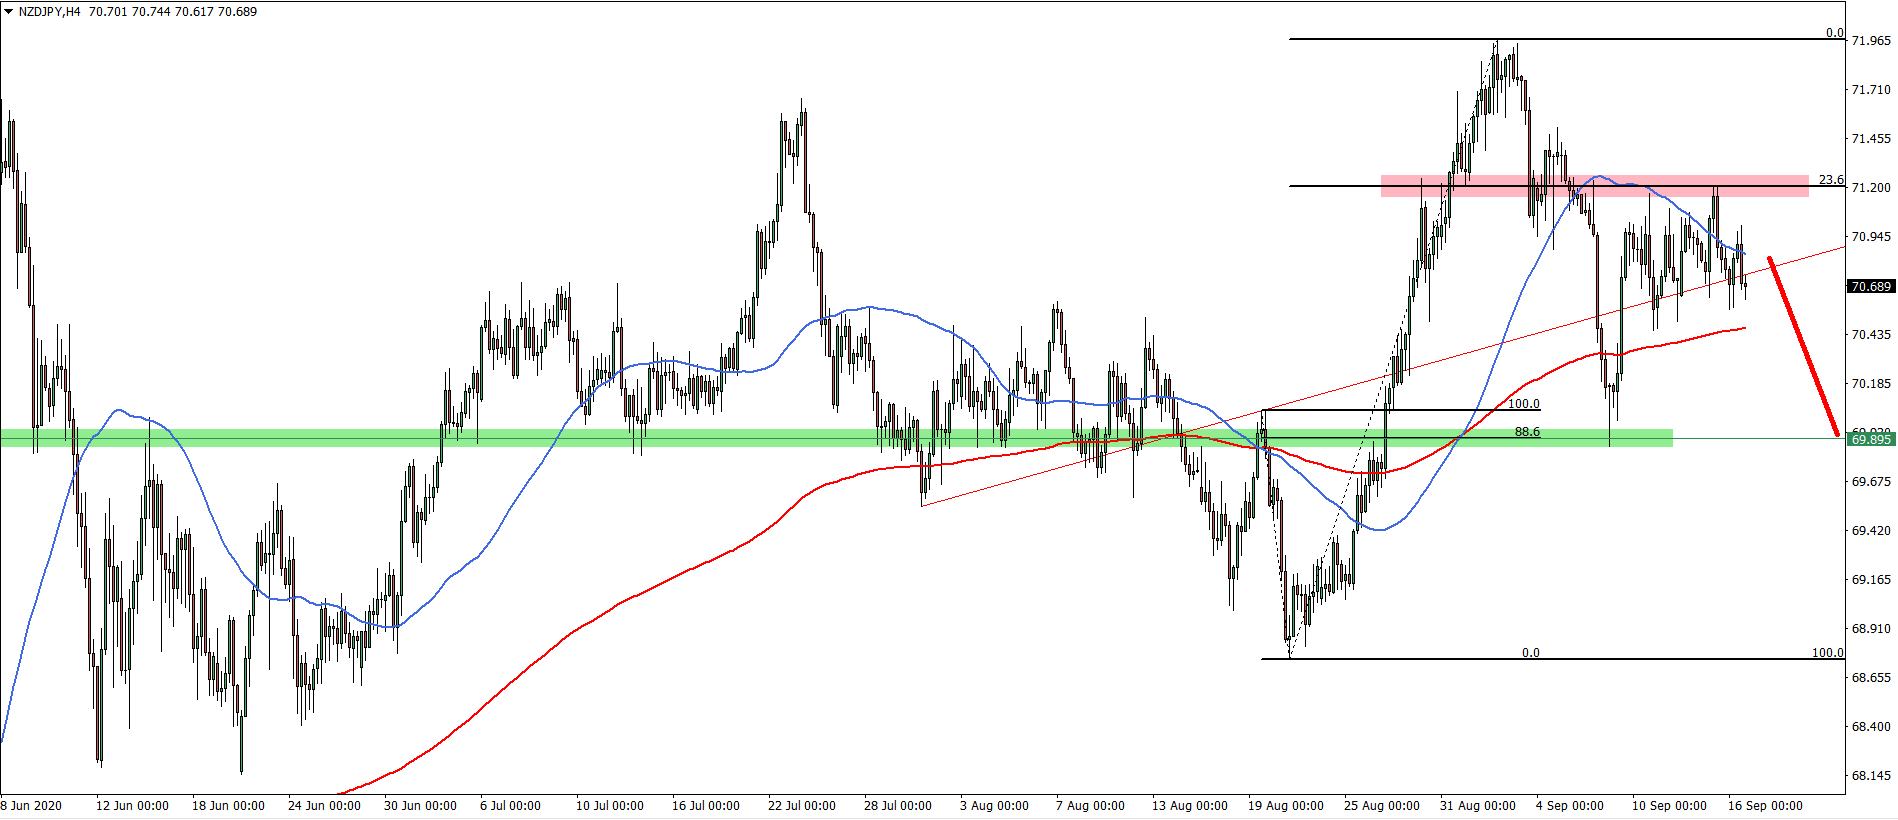
The most recent price action shows that NZD/JPY has cleanly rejected the 23.6% Fibonacci retracement level at 71.20, prior to which it broke below the average-price uptrend trendline.
While both moving averages were broken to the downside and the resistance was rejected, the probability is strongly in favor of the downside move continuation. As long as daily closing prices remain below the 71.20 resistance, the bearish pressure will be only increasing.
The price can be expected to decline towards the previous supply/demand zone near 69.86, which is confirmed by 88.6% Fibonacci retracement level applied to the last downside wave. This is a potential 80+ pips decline which can be expected as soon as this week.
To get exclusive Trading Signals, join our Premium Channel just for $29 per month


Leave a Reply