As a trader, you should always have different tools available in your arsenal to analyze and trade the market. The Fibonacci and its retracement levels are a must-learn for you.
The Fibonacci retracements are a technical tool used in Forex to define support and resistance levels. Based on a numerical series, the Fibonacci displays horizontal lines called retracements, which represent potential levels to place an order, a take profit or a stop loss.
If you are wondering how to draw a Fibonacci retracement or how to know when to place a trade. You are in the right place. In this blog post, we will teach how to make profits by incorporating Fibonacci numbers in your trading style.
Table of Contents
What are Fibonacci Retracements?
Before diving into retracements, let’s take a look at what gives them life: the Fibonacci sequence.
Following the progress of the sequence, each number is roughly 61.8% of the next number, approximately 38.2% of the following number, and roughly 23.6% of the number after that. If we subtract 23.6 from 100, the result is 76.4.
Thus, these numbers represent the Fibonacci retracement levels – 76.4, 61.8, 38.2, and 23.6. Some models also include 50.
Not all levels are equals for traders. The most robust levels considered in trading are 38.2%, 50% and 61.8%, especially the last one, since it represents price action correction of more than 50%.
In instances where the pair is moving sharply in a specific direction, there is a possibility that the pullback will equal one of the percentages within the Fibonacci retracement levels.
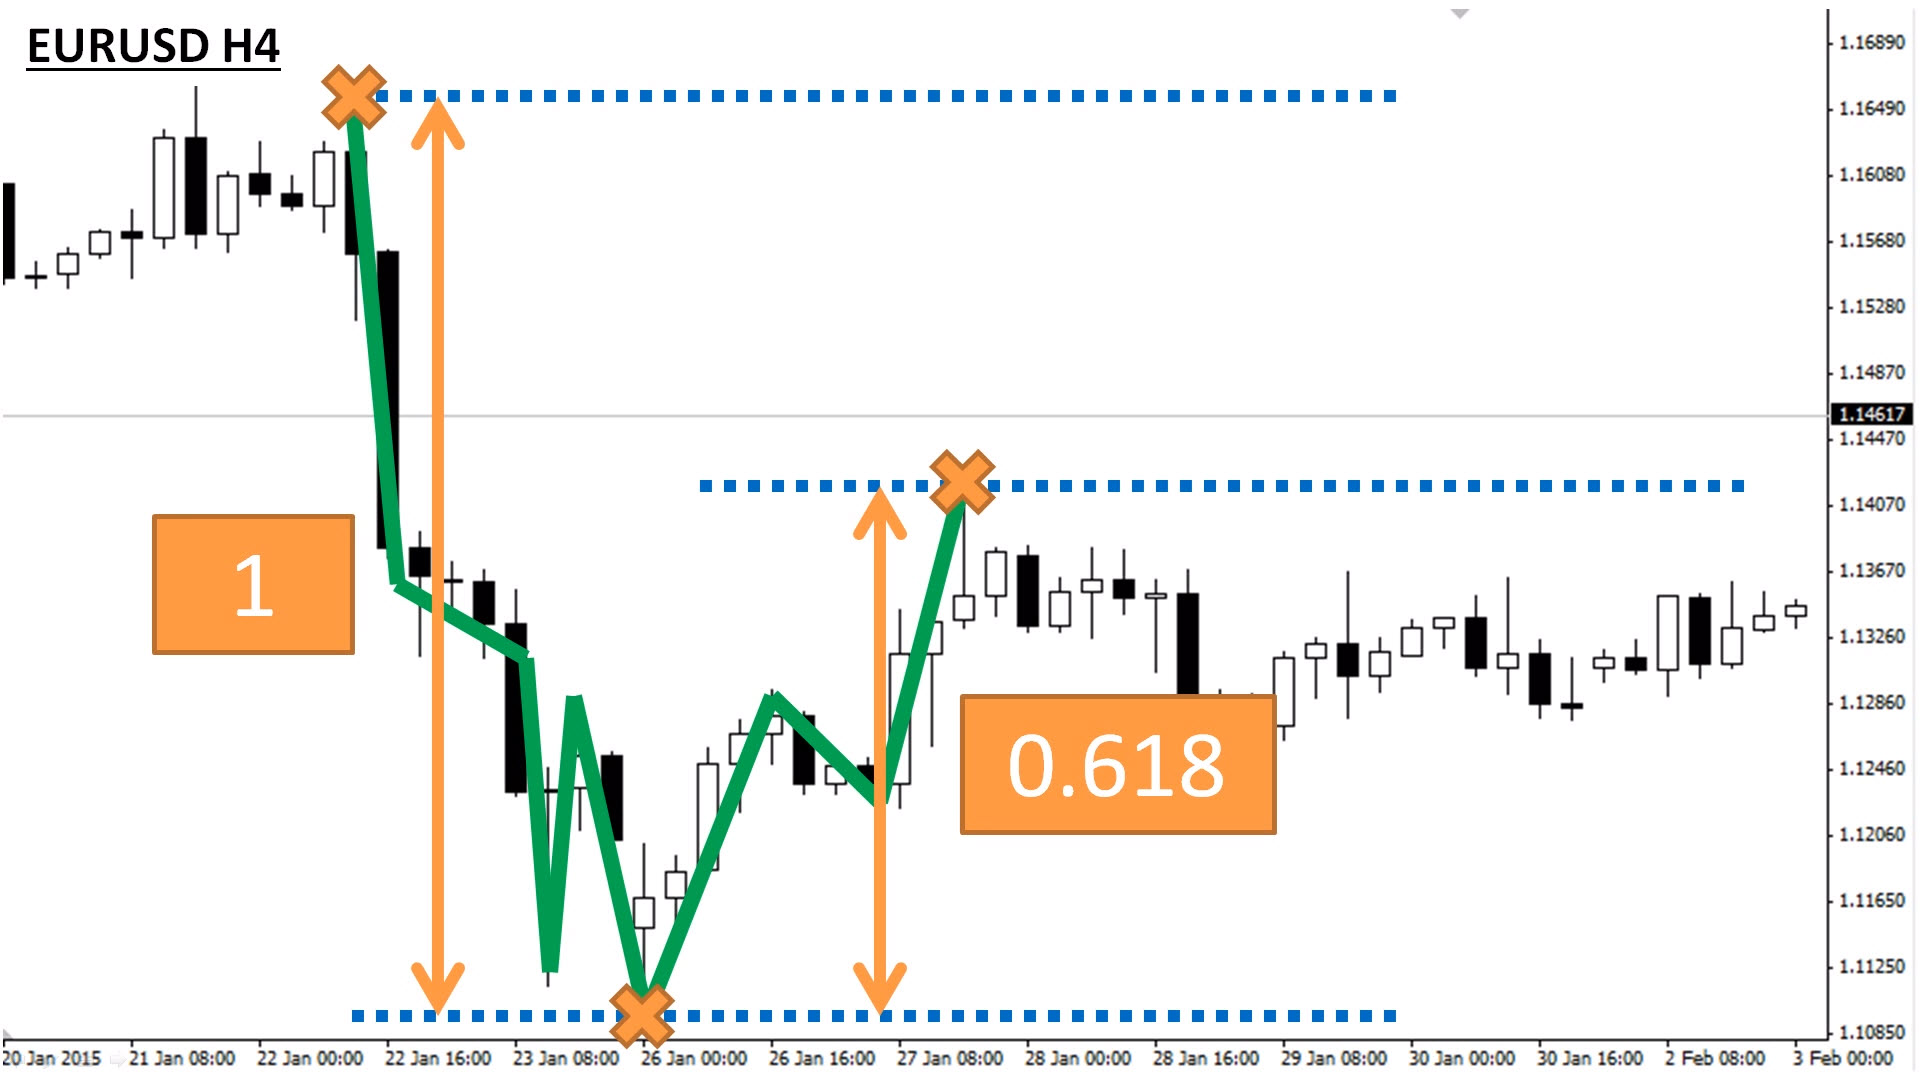
To be more specific, if EUR/USD decreases from $1.1689 to $1.1085, the expected pullback should amount to roughly 23%, 38%, 50%, 62%, or 76%. When a price is still gathering or losing momentum, it is more common to spot retracements of a higher percentage.
Why is it called Fibonacci?
Leonardo Pisano, commonly known as Fibonacci, was an Italian mathematician from Pisa, born in 1170. During his travels, Fibonacci learned about the Hindu-Arabic numerical system and documented his learnings in “Liber Abaci” (“Book of Abacus”).
Identifying and Drawing the Fibonacci retracement lines
There are different strategies and tools based on Fibonacci numbers. However, traders mostly use Fibonacci retracements and extensions. This is because they are relatively simple to use and because you can apply them to all pairs on all time frames.
The Fibonacci retracements are used to point out and confirm support and resistance levels, set stop-loss orders, or target prices, and use them as a primary tool in a counter-trend trading plan.
Looking at Fibonacci retracement levels, you can see that they use horizontal lines to point out the position of potential support and resistance levels.
Every level corresponds to each of the ratios or percentages mentioned above. Each percentage level represents how much of the previous trend the price has traced back. Once the price has retraced to one of the Fibonacci levels, a bounce is likely to happen.
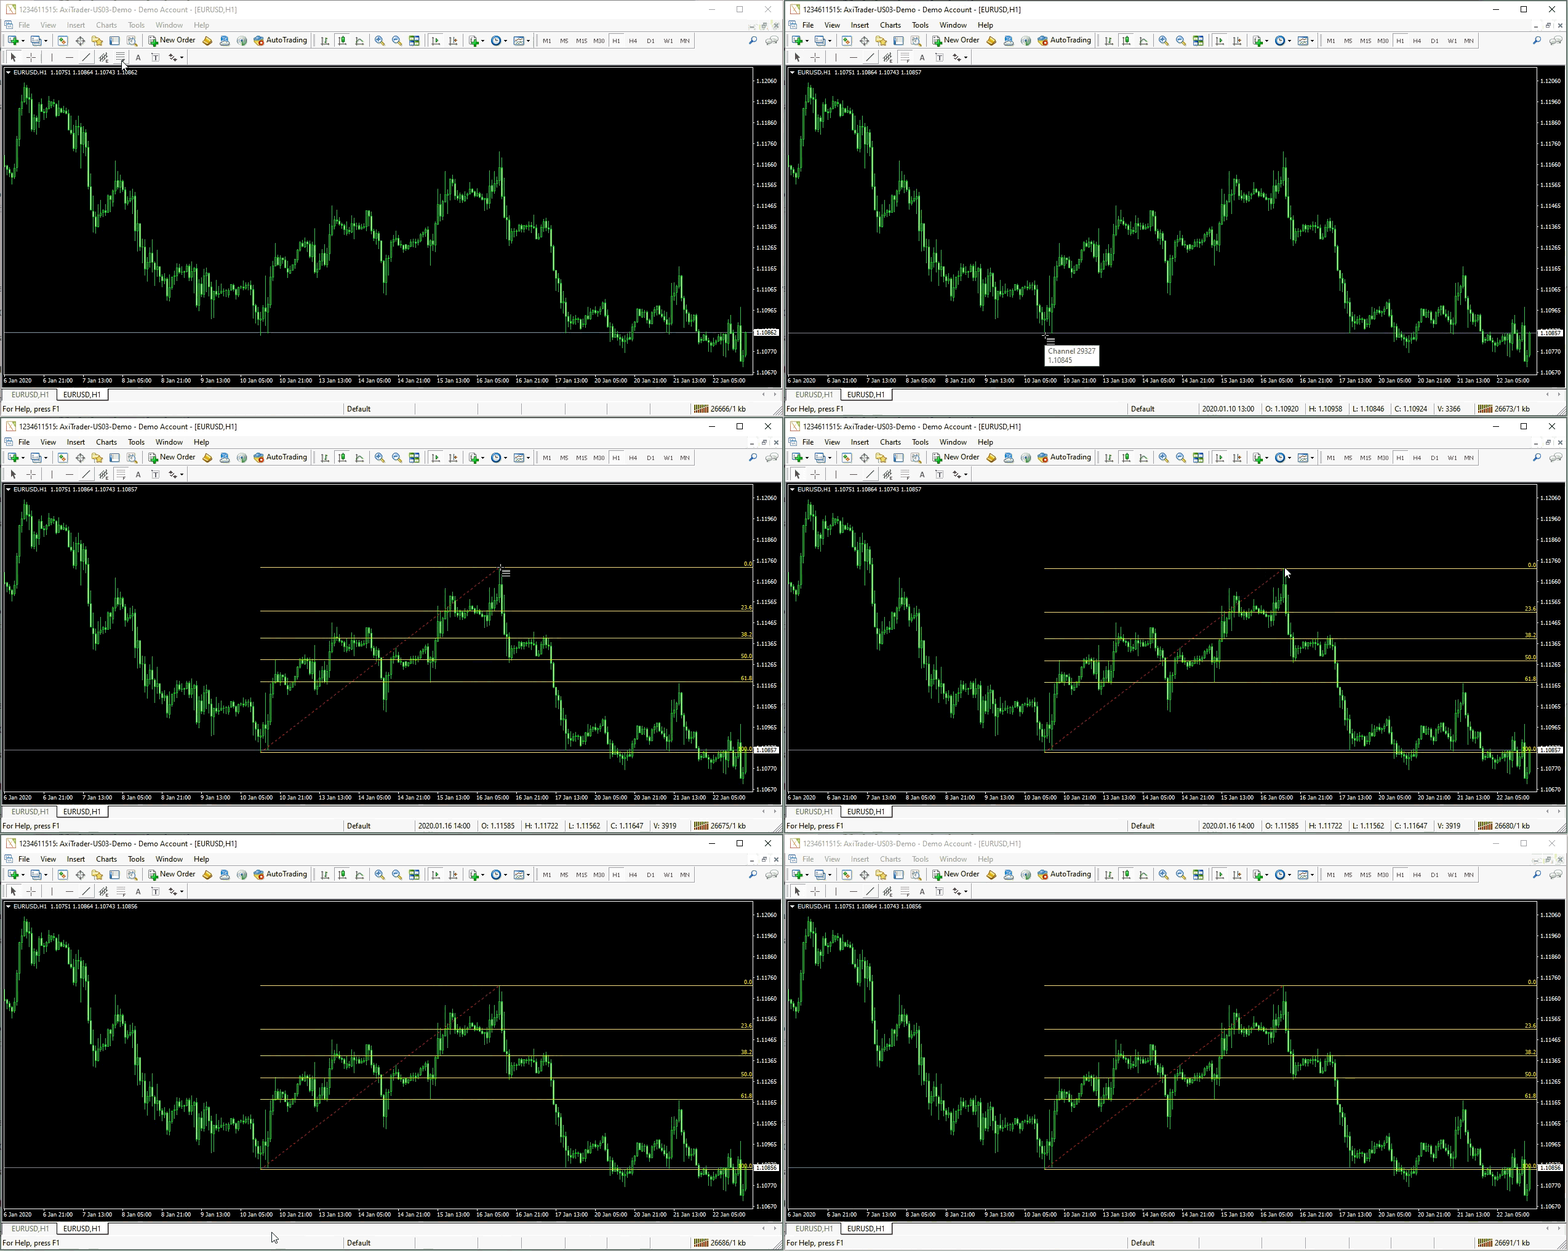
MetaTrader 4 trading platform offers a simple way of drawing the Fibonacci lines. As seen in the photo below, you simply click the Fibonacci button in the toolbox located in the top left part of your screen:
![]()
Drawing Fibonacci Retracements on MetaTrader4 (MT4)
Once you click it and the tool is selected, you need to identify an important price point on the chart where the uptrend or downtrend started, and a point when it ended.
In a Downtrend
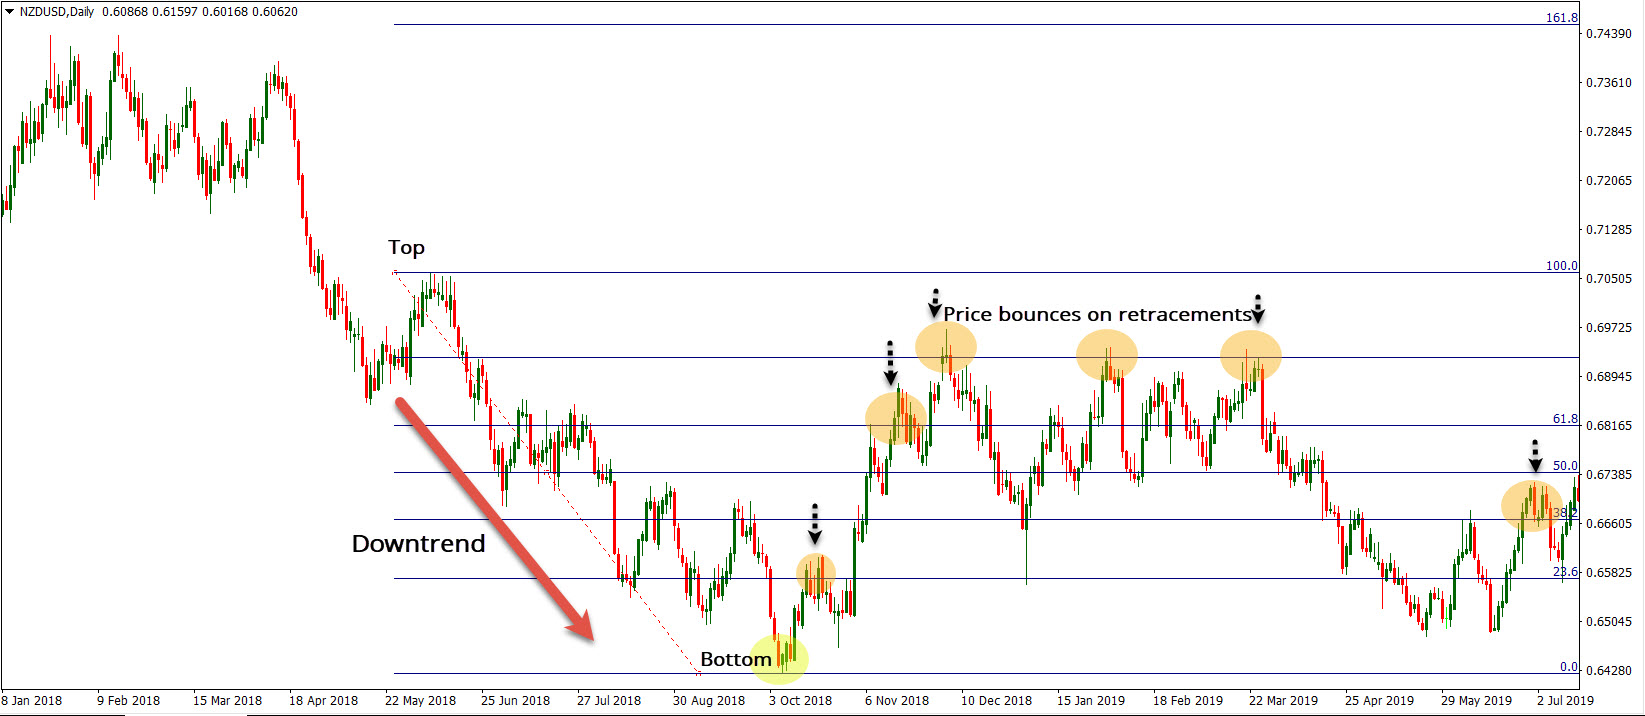
If you look at the chart below, the NZD/USD had been moving low for some time. Once the pair had created a new short-term bottom, the price action rotates higher as it attempts to recover. At this point, we want to see where the retracement lines are located because of the following two reasons.
Fibonacci retracement on NZD/USD daily chart (MT4)
First, if you bought the pair near the bottom, you are looking at the retracement levels as your potential profit-taking orders. As outlined earlier, retracements start with 23.6% and end with 78.4% or 78.6% (both levels are used). Hence, you may set your profit-taking at 38.2% or any other level.
Secondly, you may believe that the downside risk is still very much present, and you are merely looking for opportunities to get on the short side.
The stronger the prevailing trend is, the shorter a retracement is expected. Thus, if the market trends in a solid downtrend, you’d be looking at 23.6% or 38.2% as possible retracements.
In both scenarios, you can draw the lines by using the same method. What you need to do is select the point at which the price action started trending in one direction, and hold the cursor until you connect it to the price point on the other extreme.
In this particular regard, we connected a high with the low since it is a downtrend. The first point from which you started drawing the lines should have “100%”, while “0%” should be located on the final point.
In an Uptrend
Let’s take a look at another example, but now the price action trends upwards.
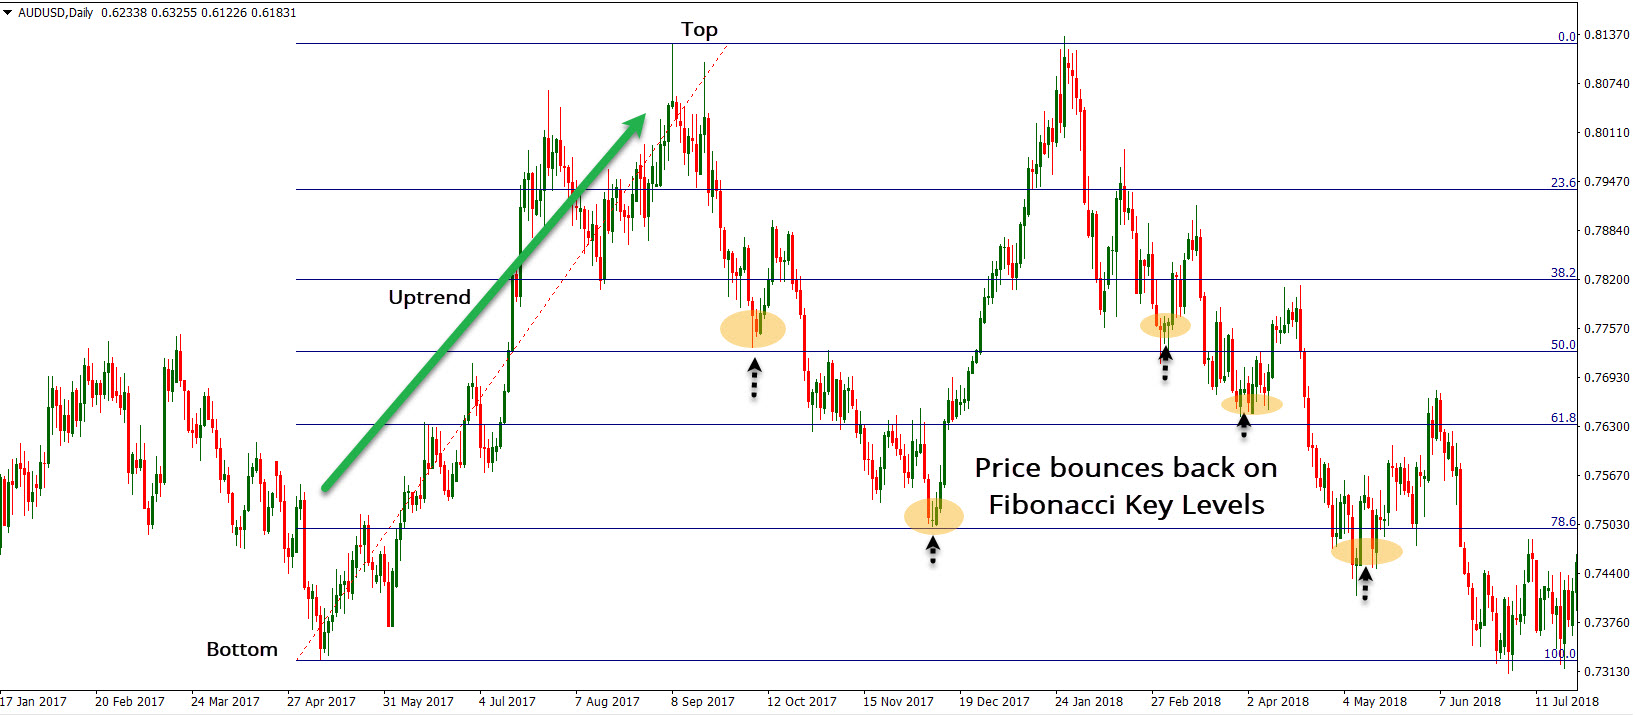
The AUD/USD has moved higher and we want to identify the retracement levels as target points. Again, we take the cursor from the bottom end of the screen to the highest recorded point.
Fibonacci retracement on AUD/USD daily chart (MT4)
This was a swing move, which is now used as an indicator to help us determine levels in between, which may have a role to play in the price action. Please note how the price changes direction as it gets closer to Fibonacci levels.
Identifying Fibonacci Extension lines
Similar to the Fibonacci retracements, extensions are used to determine support and resistance areas. However, extensions represent the lines that are located beyond the endpoint.
Extensions value relies on signaling support or resistance levels, which are often difficult to find using other technical methods.
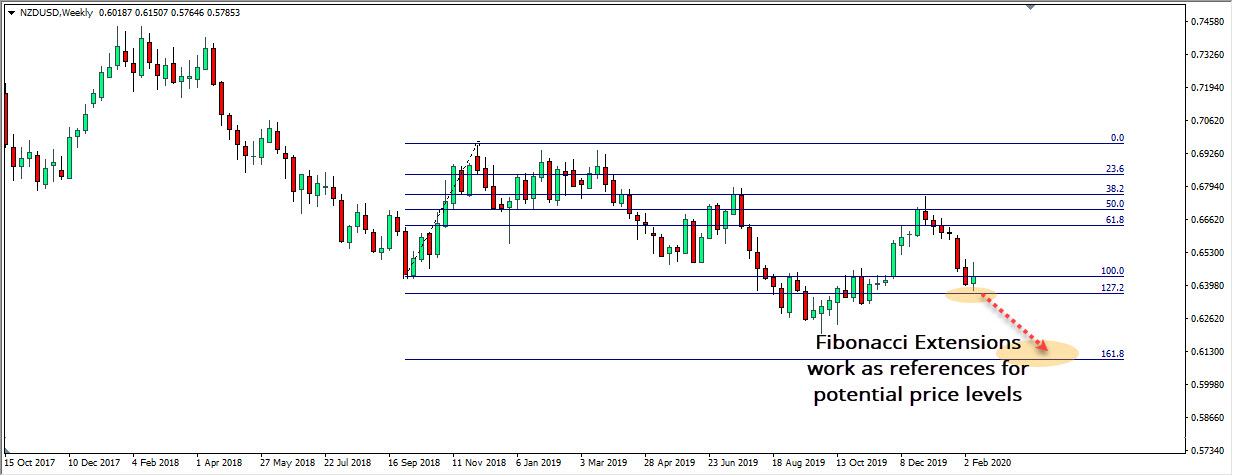
Below you can see a NZD/USD weekly chart. The price action has been moving lower for some time, creating a new low. At this point, it is challenging to project where the price breaks to the mentioned lowes price.
Fibonacci extensions on NZD/USD weekly chart (MT4)
For these reasons, we use the Fibonacci extensions to identify essential levels if the price action breaks behind the previous low or high. Hence, if the price action moves through one extension level, it may continue moving toward the next. In general, there are three primary extension levels used in trading: 127.2%, 161.8% and 261.8%.
The Fibonacci extensions are measured in the same way as retracements. You connect two endpoints and, besides retracement levels, you get extension levels that extend behind the 100% mark.
How to trade the Fibonacci retracements and extensions
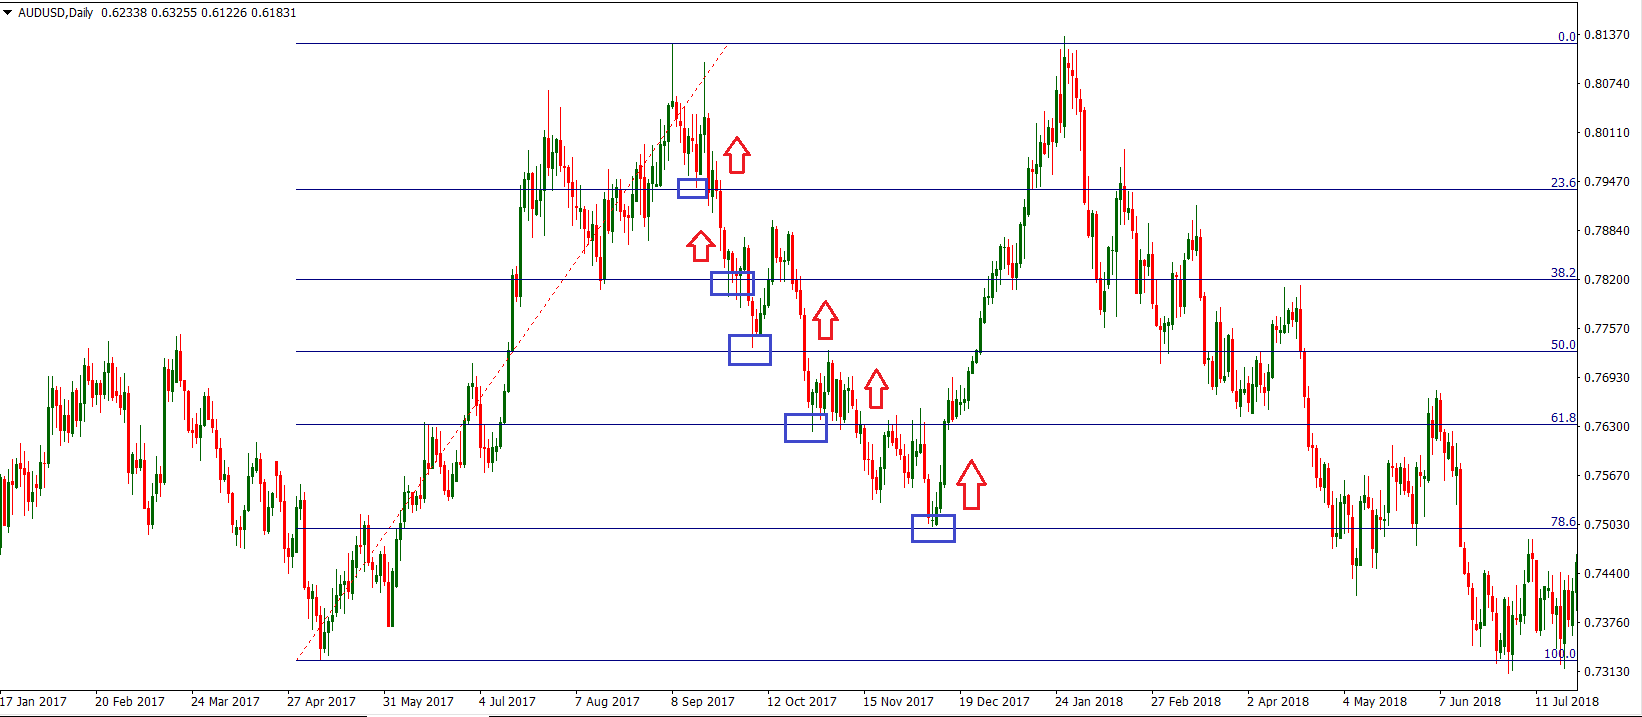
Let us review some tips on how to trade the Fibonacci levels. If you go back to the AUD/USD daily chart, you will see that the price action reacts to all five levels, starting from 23.6% to 78.6%.
Trading Fibonacci retracement on AUD/USD daily chart (MT4)
Note how the price action behaves when it gets closer to Fibonacci levels. There was a bounce in the price action every time it got close or touched the Fibonacci level.
If you are a scalper, you could simply aim to extract 10-15 pips out of every level. A stop loss should be placed on the other side of the given Fibonacci line.
If you are aiming to get more pips as you’re a swing trader, then you should ignore the first Fibonacci retracement line, 23.6%, and look for a deeper pullback to get on the long side.
It is no surprise that the most significant reactions occur from 50%, 61.8% and 78.6%. The deeper the price action retreats, the more buying interest it attracts.
Trading Fibonacci Extensions
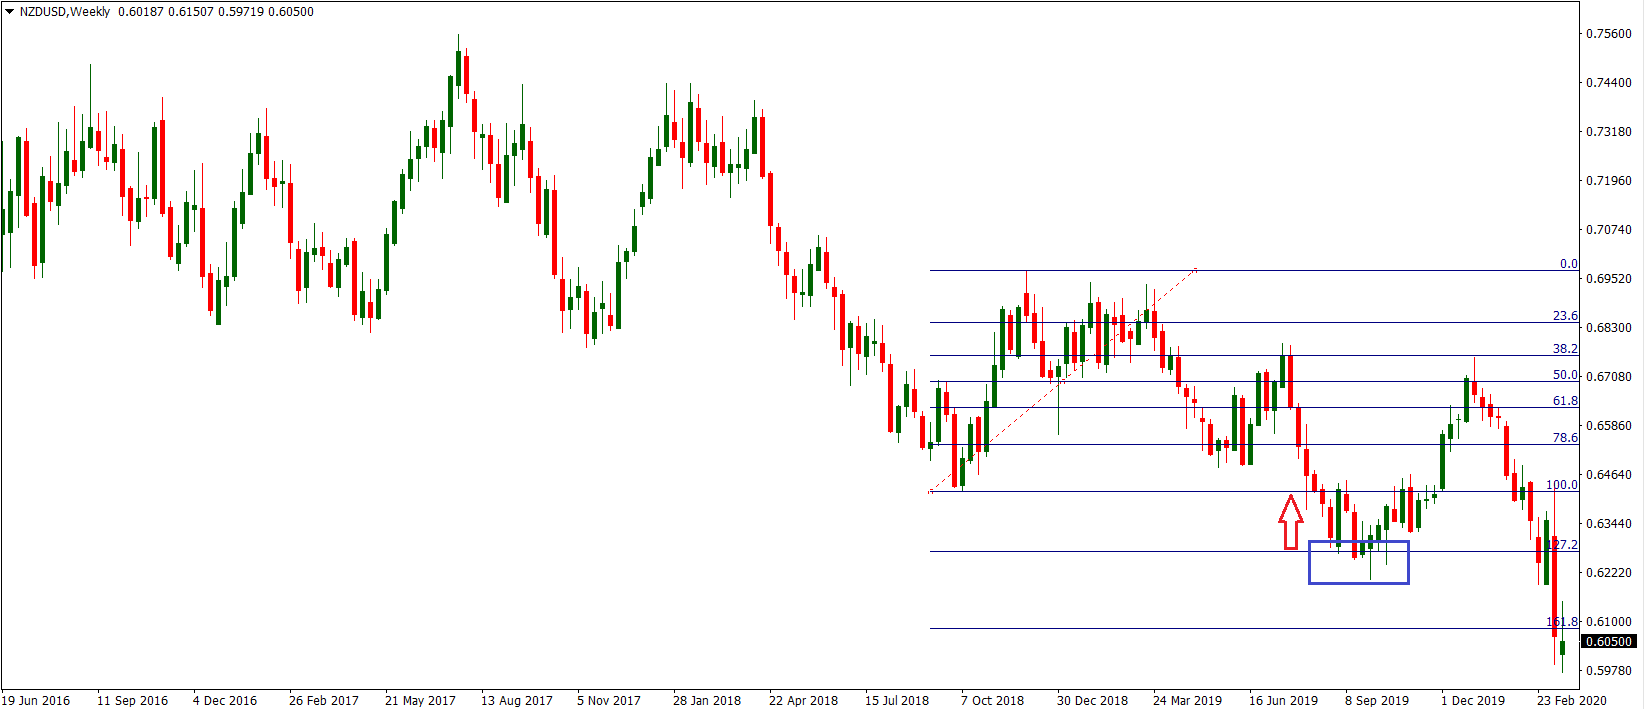
Extensions are traded similarly. The price action touches the 127.2% extension, after the break of a swing low. This means there is an opportunity to go long as this is where the buyers have grouped themselves.
If you look closely, you will see that after a tag of 127.2%, there is a long bullish candle which confirms strong buying interest in this area.
Trading Fibonacci extensions on NZD/USD weekly chart (MT4)
The price action ultimately returns to test the “ground zero”, or the previous swing low before it rotates lower again.
There are two trading examples here:
- You could have shorted the NZD/USD on the break of 100%, and by drawing extensions, you closed the trade in profit at the first touch of 127.2%; or…
- You noticed the 127.2% level as a support, and you placed a buy trade looking for a rebound in the price action. Both trade setups would have brought you money.
Limitations
There is a reason Fibonaccis are so common and popular amongst traders. They can verify a trade signal that you get in the area of Fibonacci levels, or draw target lines in a chart.
In essence, they are considered a simple tool for identifying levels of support and resistance.
However, it’s important to understand that using the Fibonacci retracements is very subjective. Given that there are several price swings in a single trading day, it doesn’t mean that every trader will be connecting the same two points. As always, you should combine signals generated by Fibonacci with other technical indicators.
Not every trader is drawing the same Fibonacci
The two points you connect may not be the ones other traders connect. One of the strategies assumes drawing retracement levels on all major price swings to mark where there is a group of Fibonacci levels. Doing this may help you point out a critical price area.
Although they can be very helpful, Fibonacci retracements will not always identify the exact inflection points. Fibonacci levels indicate an estimated entry area rather than a precise entry point.
If you look at the examples shown above, you will see that the price action sometimes comes short of tagging the exact level, and sometimes it overshoots it and extends deeper.
Hence, it doesn’t always mean that the price will stop and reverse at some of the Fibonacci levels. This is especially the case if the market is in a strong trend, where you may see the price shooting through multiple Fibonacci levels in a single swing.
When the price traces back 100% of the last price wave, the trend could be in doubt as buyers/sellers gave up all previous gains. Implementing Fibonacci retracements on small price swings may not give you much insight, because the levels will be so close to each other that every price level may seem important.
Live Trading Example
The video shows a price interaction with the 61.8% Fibonacci level, which leads to a bounce from the area and to a new impulse in the direction of the previous trend. This created a nice trading opportunity on the chart, which our analyst took advantage of.
Advanced Fibonacci Trading Strategies
Fibonacci Retracement and Elliot Waves
The Elliott Waves Theory cannot exist if it weren’t for the Fibonacci sequence. So important these levels are, that all the theory’s rules use them.
Here are some of the most important Fibonacci extensions and retracements levels in Elliott Theory rules:
- In an impulsive wave, at least one wave needs to extend. But, the extension means the wave is bigger than 161.8% of the previous wave.
- The b-wave in a flat pattern MUST end beyond 61.8% Fibonacci retracement when compared with the previous a-wave.
- At least three legs of a contracting triangle must retrace 50% of the previous leg.
- The b-wave in an irregular flat is smaller than 138.2% when compared with the previous a-wave.
- The un-extended waves in an impulsive move related to the golden ratio.
The list above is just to show the importance of the Fibonacci numbers in the theory. We can go on like this with pages of different rules. However, it will only highlight the strong dependency between the Fibonacci retracement levels and the Elliott Waves Theory.
But the Elliott Waves Theory doesn’t use the Forex Fibonacci levels only to refer to price, but also to time. The now famous rule of equality in an impulsive wave uses both price and time related to the golden ratio values.
Elliott found that every pattern uses Fibonacci levels. In fact, he defined the patterns based on different Fibonacci levels. That is, how to trade each pattern.
Fibonacci Retracement in Triangles
Triangles are powerful patterns. Price spends most of the time in consolidation areas. As such, triangles form very often.
Elliott found that there’s a strong connection between the legs of a contracting triangle and different Fibonacci levels. All you should know is the length of the a-wave. Or, the first leg of the triangle.
One of the rules regarding triangles is that at least three legs must retrace more than fifty percent of the previous leg. If the triangle is bullish, all traders must do is to find that level and trade long every time the price reaches it.
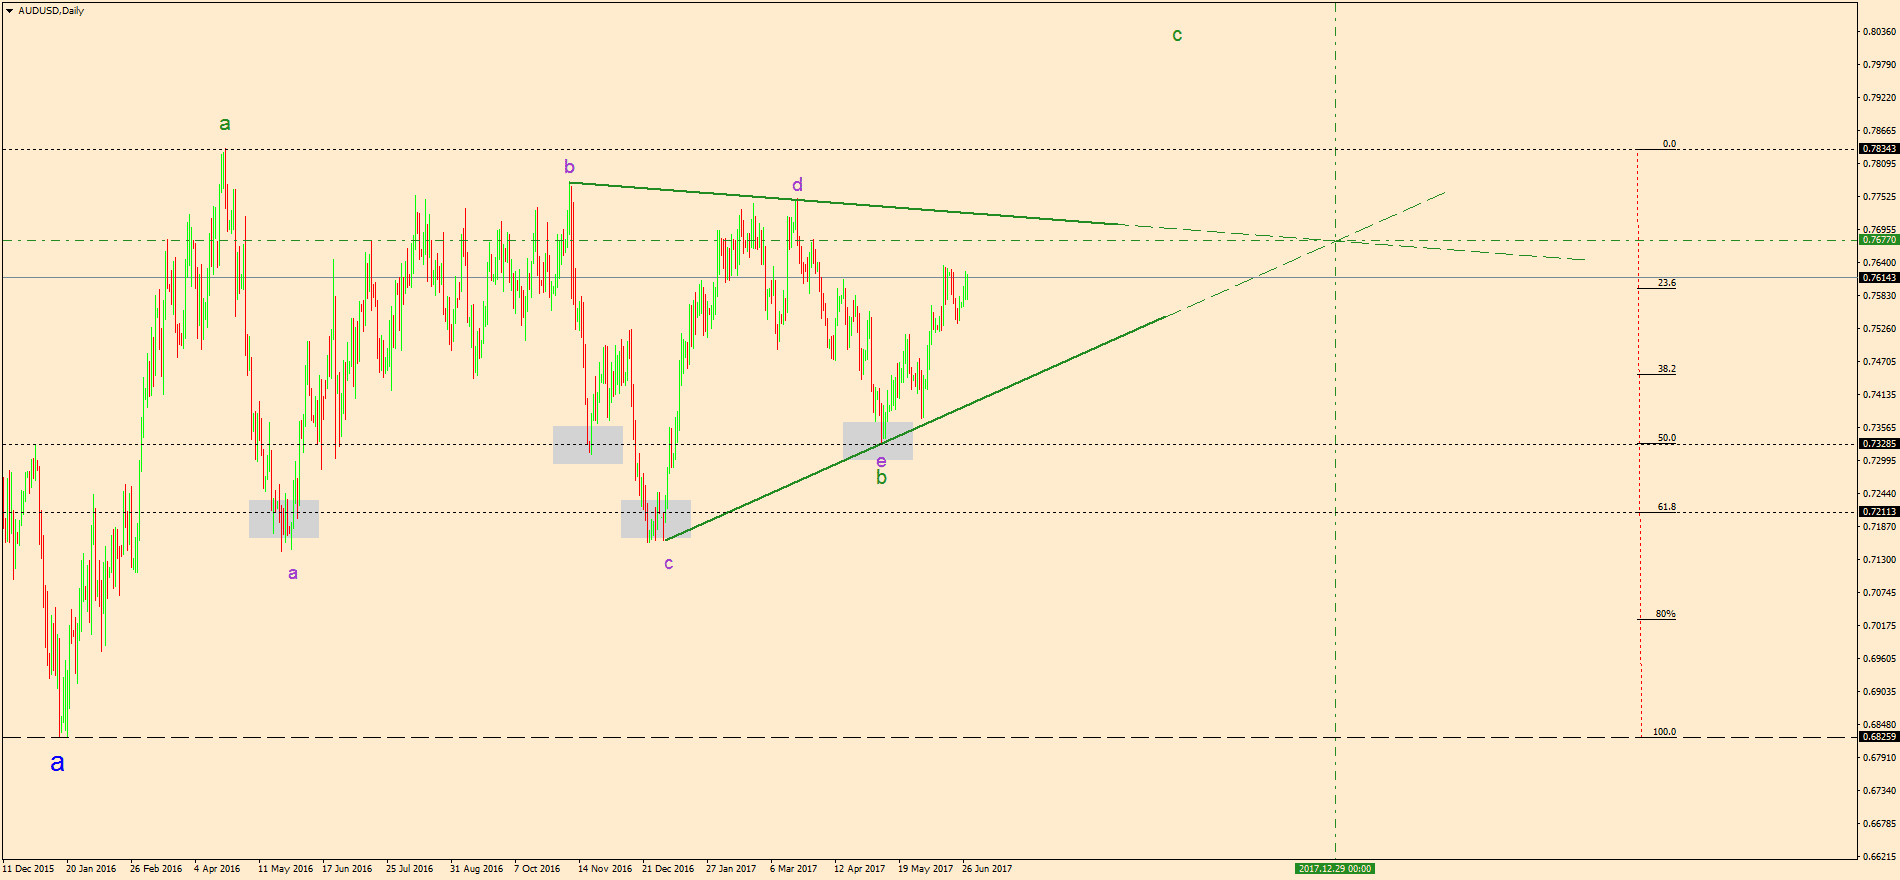
Below there’s the AUDUSD daily chart. You can’t miss that triangle, no matter how hard you may try.
A simple look at it tells you the bias is bullish. Because of the higher lows series, traders have a bullish bias.
A sound Forex Fibonacci approach is to measure the length of the a-wave with a Fibonacci retracement tool. The idea is to find the 50% and 61.8% levels.
In any triangle, the focus stays with the b-d trend line. The moment it gets broken, the triangle ends.
Until then, traders can scalp/swing trade their way in the triangle. As such, buying 61.8% and 50% retracement areas for the b-d trend line’s break will do the trick.
In this case, the trading strategy offered little or no retracement. That’s truly remarkable.
How to Use Fibonacci Time Zones
One of the less known Forex Fibonacci indicators is the Fibonacci time zones one. It appears together with the other Fibonacci tools. The only difference is that it refers to time, not price.
Elliott Waves Theory is the only trading theory that allows traders to incorporate time to an analysis. Because of this, a sound Elliott Wave forecast values more than other trades.
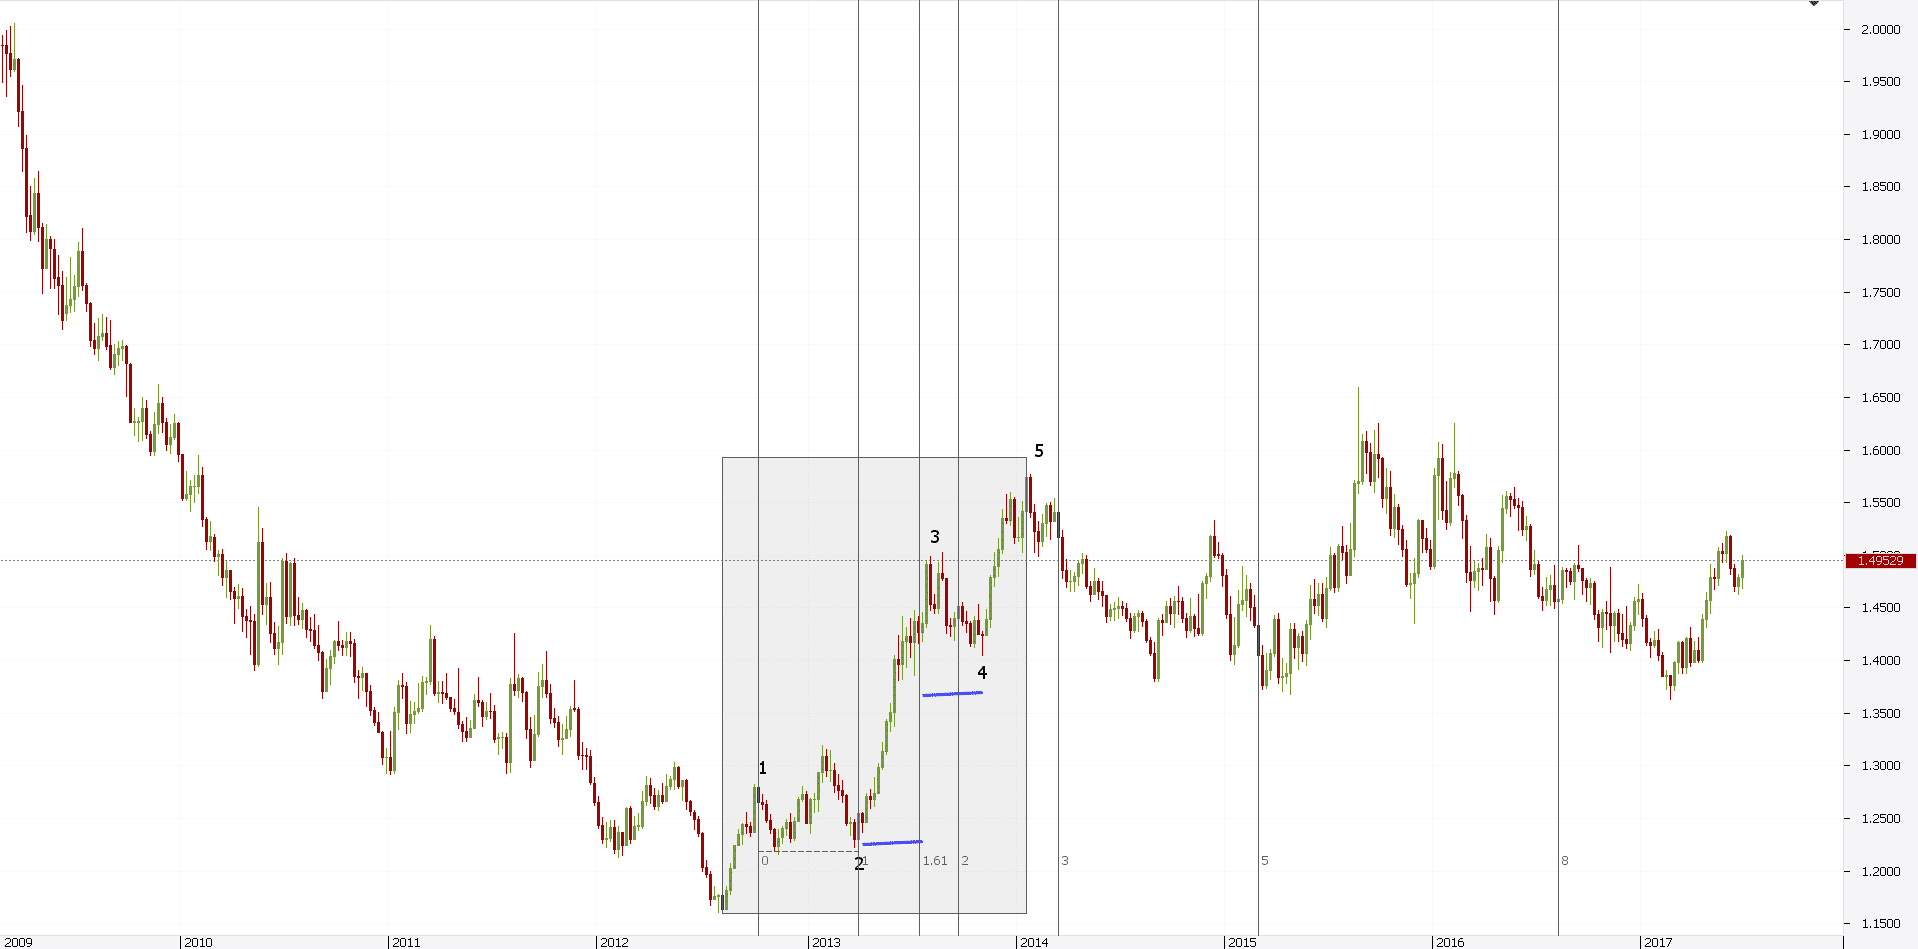
The EURAUD chart below shows an example of how to use the Fibonacci time zones indicator. In an impulsive wave or a five-wave structure, the time zones indicator gives the estimated time the 4th wave will take.
In most cases, this will take 61.8% of the time taken for the 2nd wave. This way, not only traders know the price, but also the estimated time when the price will come.
The way to find this simple. On the MT4 trading platform, select the Fibonacci time zones tool from the dedicated Fibonacci tab. Then, simply click at the start of the 2nd wave. Next, drag the tool until the end of it.
If the 161.8% Fibonacci Forex level doesn’t appear, you can Edit the tool and add it. Finally, take the 61.8% measurement (the blue line in the chart above) and place it from the end of the 3rd wave.
The result will give an educated guess about the 4th wave time. There’s no rule related to the 4th wave price retracement.
However, using time, traders can “time” the moment they go long for the 5th wave.
Summary
Fibonacci levels can help you spot areas of interest that may play a key role in future price action. Below you will find the key takeaways from this blog post.
- Fibonacci is a technical tool used in trading to define support and resistance levels
- Two most popular types of this indicator are the Fibonacci retracements and extensions
- Retracements are used to identify levels where the price retreats from a certain point. There are five major Fibonacci retracement levels: 23.6%, 38.2%, 50%, 61.8% and 78.6%
- Extensions are located beyond the endpoint, after which it is difficult to find support or resistance levels by using other technical methods. The three most important Fibonacci extensions are 127.2%. 161.8% and 261.8%
- Although Fibonacci lines are top-rated amongst traders, they are far from perfect. It is important to cross-check signals and the level they generate with other technical tools.



Leave a Reply