The bias is bearish as long as there is no 4h break and closes above the 1.7480. It seems like currently GBP/CAD could be presenting a selling opportunity, which would be reasonable to use after the weekend to avoid any “price gap” risks.
Disclaimer: The analysis presented in this article is for educational purposes only and should not be considered as financial advice.
This analysis was done on MetaTrader 4.
Click below to open a Free Demo Account with our trusted brokers:
Get a 30% deposit bonus with your new live AxiTrader account (only for non-US residents)
Trade Idea Details:
GBP/CAD symbol
Trend: Bearish
Key support levels: 1.7170, 1.7020
Key resistance levels: 1.7481, 1.7500
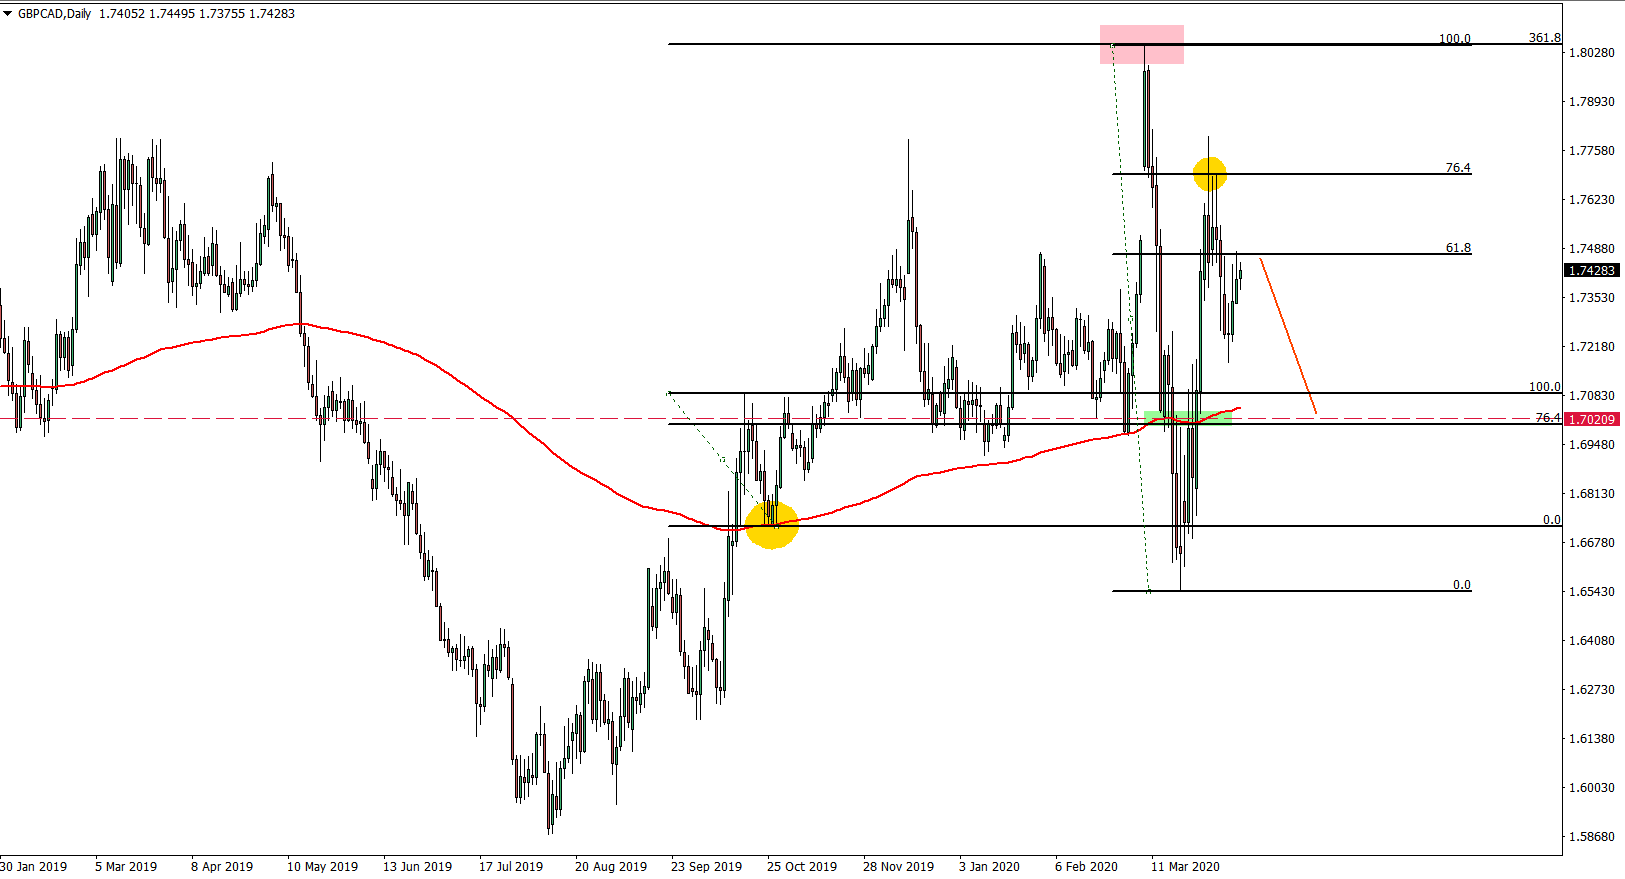
Price Action: Below is the Daily chart where we can see that price has reached 361.8% Fibonacci retracement level applied to the corrective wave down after 200 SMA breakout. After 1.8050 bounce, the price went sharply down and broke below the 200 SMA. The following move was yet again quite sharp where the price went from 1.6542, up to 1.7796. But then after 4 days of consolidation, price rejected 76.4% Fibonacci retracement cleanly suggesting price weakness.
At this stage, it seems that GBP/CAD is at the attractive sell level after the price has been on the rise for three consecutive days. The downside target corresponds to the 200 SMA breakout point and is located near the 1.7020 area.
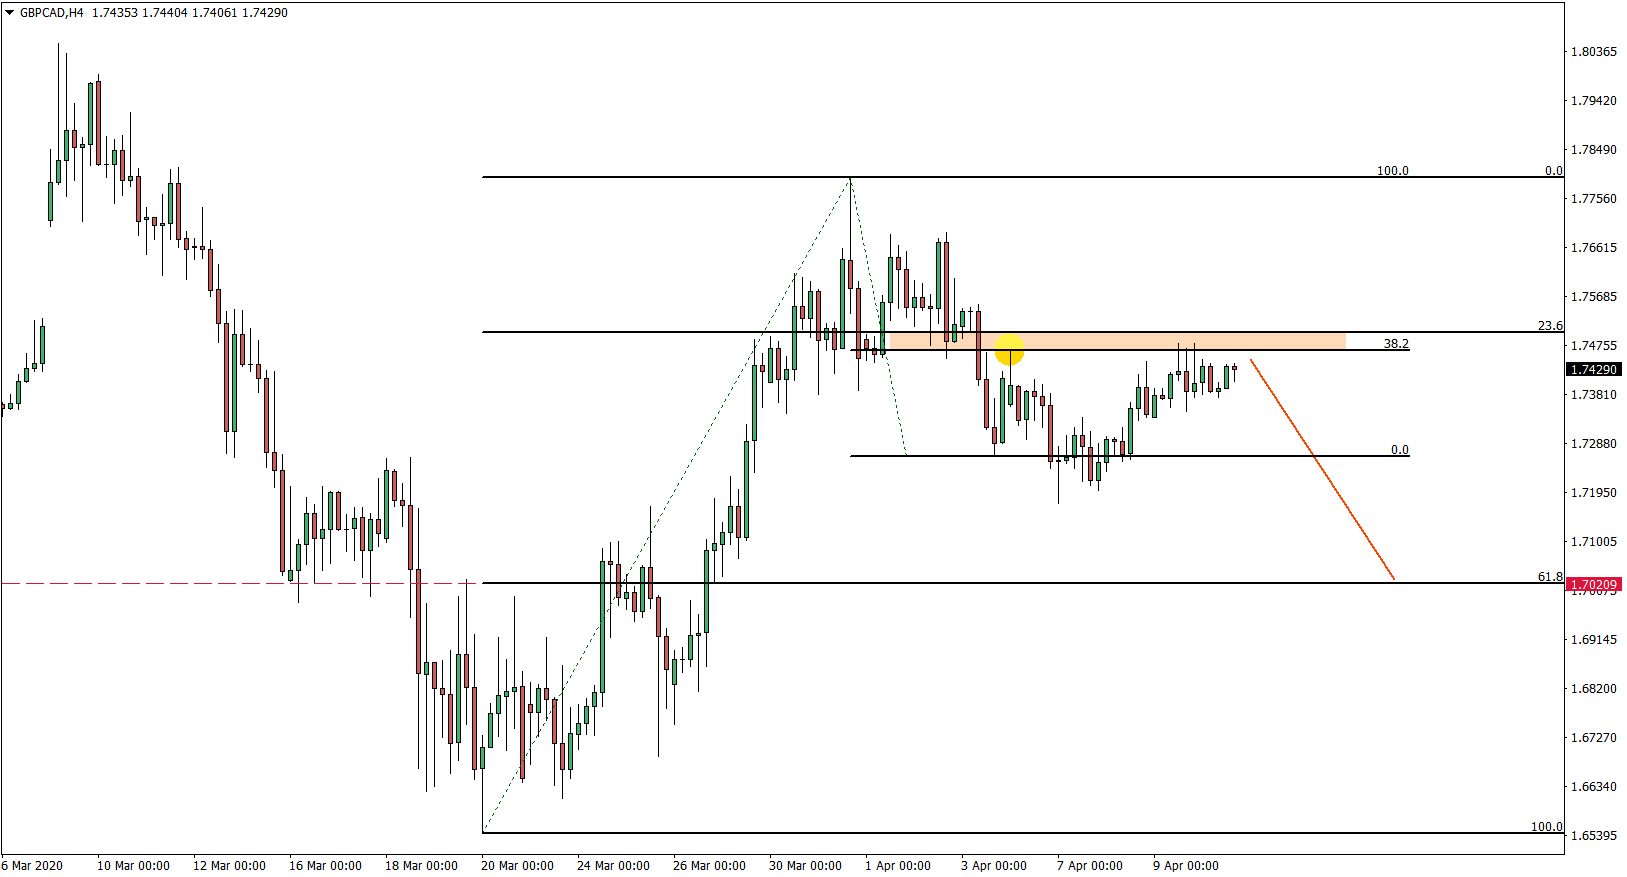
Now let’s have a look at the 4-hour chart, where we can witness the formation of the resistance at the 38.2% Fibonacci retracement level at 1.7665. This level at first was rejected cleanly, but then price attempted to break higher, although failed to do so. From now on, we can expect some consolidation before/if the price starts moving lower. And it would be reasonable to wait until the Monday open and only then look for selling opportunities on small pullbacks to the upside. The downside target on the 4-hour chart is seen at 61.8% Fibs, which is 1.7020 level.
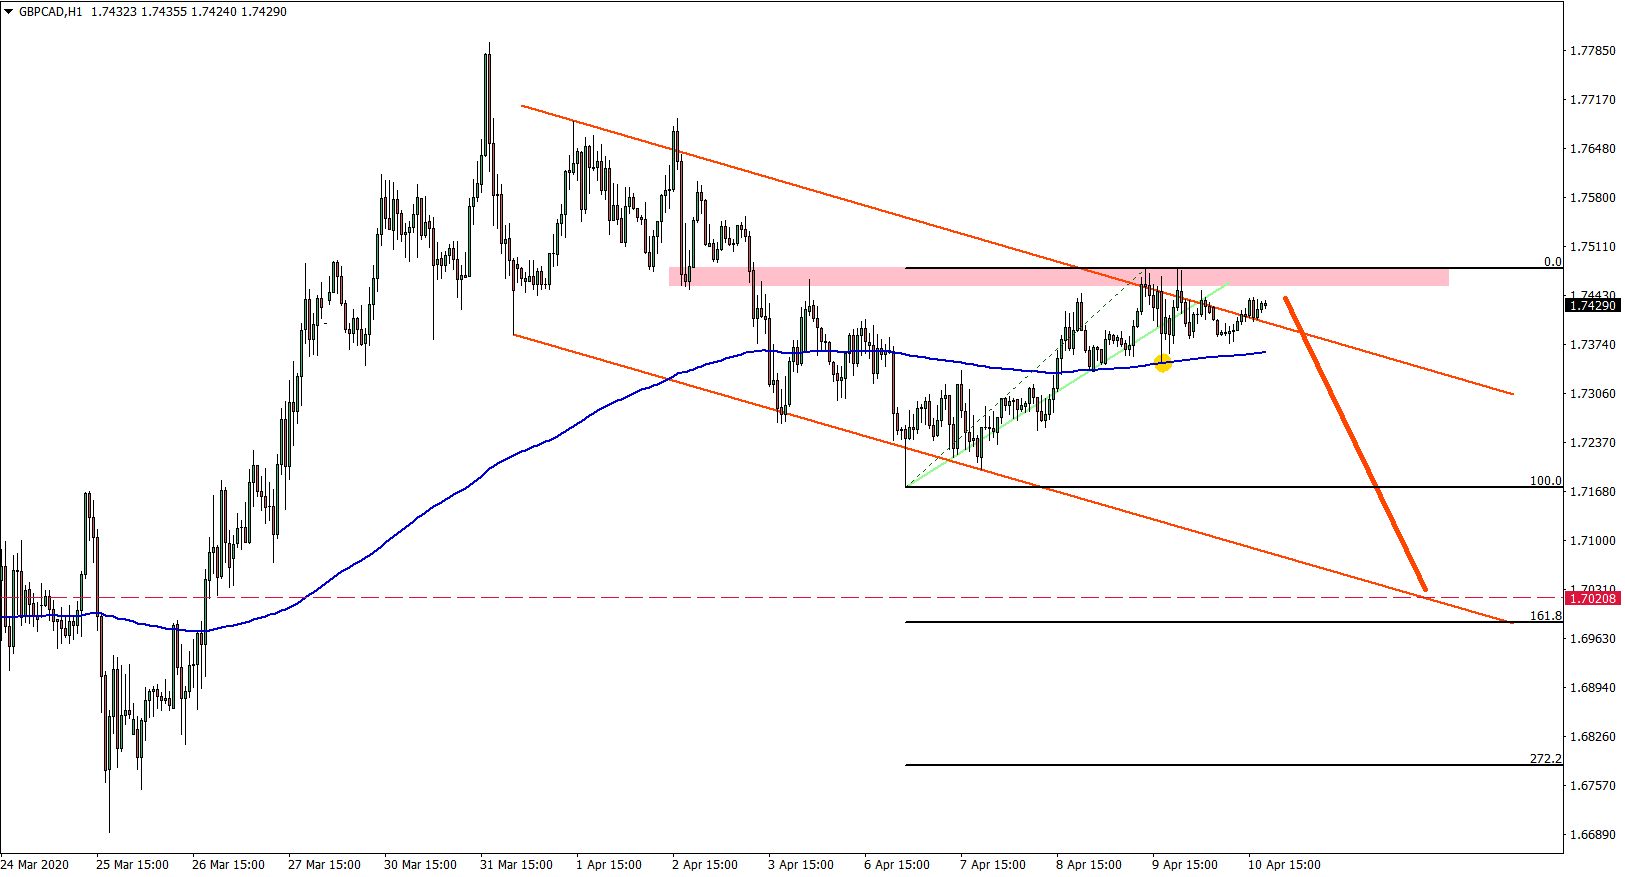
Finally, below is the 1-hour chart, where the price has reached to top of the descending channel. At the same time, we can see the clean bounce off the 200 EMA, after which price failed to produce a new higher high. This could be the indication of further price weakness and GBP/CAD is expected to move down, as long as the 1.7480 resistance level is being respected.
Potential Trade Idea: While the shorting opportunity is already there, it is suggested to wait for a couple of hours after the Monday opening and look for any correctional moves to the upside to go short. At the same time, there must be no big price gaps to the upside. The exit signal can be the 4h break and around the 1.7480 area, although daily close above this level would be preferable. For the downside target, there is a strong support area between 1.6985 and 1.7020. This area corresponds to multiple Fibonacci levels as well as the lower trendline of the descending channel.


Leave a Reply