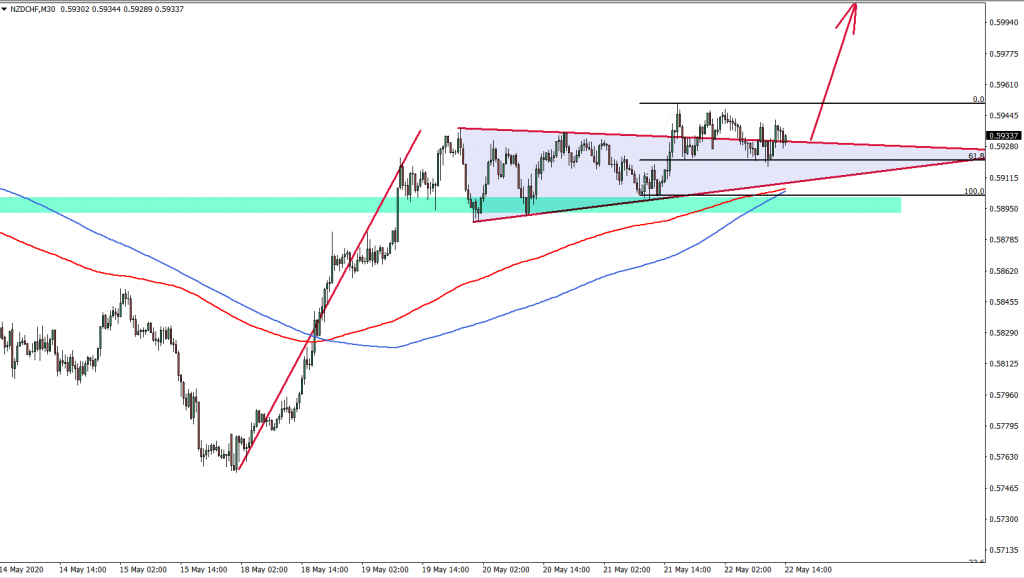
NZD/CHF has been consolidating during this week and stayed within the triangle pattern. The consolidation seems to come to an end after breaking the triangle and the price is expected to rise, starting next week.
Disclaimer: The analysis presented in this article is for educational purposes only and should not be considered as financial advice.
This analysis was done on MetaTrader 4.
Click below to open a Free Demo Account with our trusted brokers:
Trade Idea Details:
NZD/CHF symbol
Type: Bullish
Key support levels: 0.5920
Key resistance levels: 0.5950
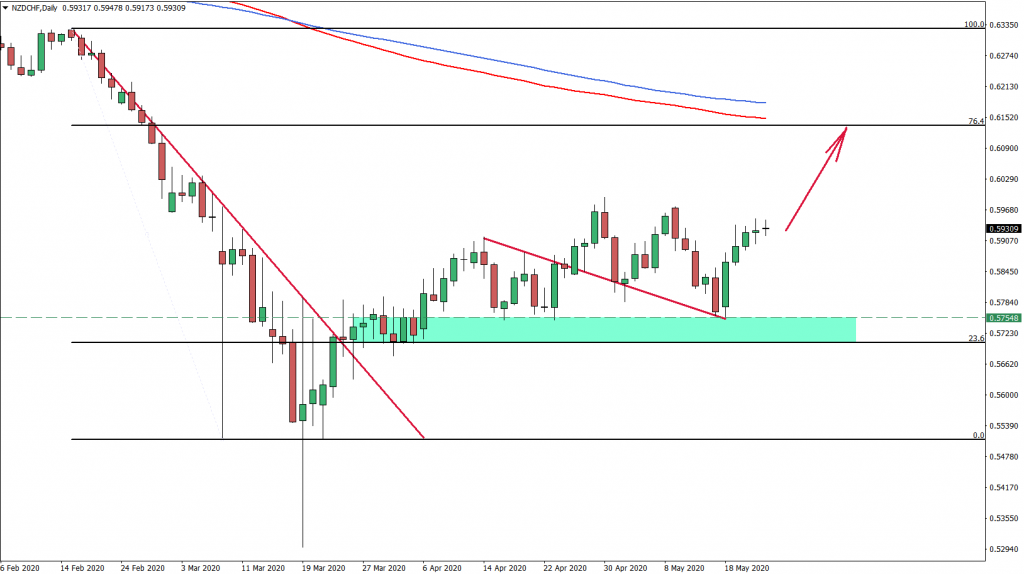
Price Action: Starting off with a Daily chart, price broke above the long term downtrend trendline. After the breakout, a strong support zone at 0.5755 has been formed, which price rejected multiple times. We can already see a higher highs higher lows pattern, which suggested the validity of the uptrend. This might result in price moving wards the 76.4% Fibonacci retracement level at 0.6134 because it corresponds to 200 Simple and Exponential Moving Averages.
But if we look at the 4-hour chart, NZD/CHF still remains below the downtrend trendline and still rejecting 76.4% Fibonacci retracement level at 0.5937. On the other hand, the price remains above the 200 MAs, and perhaps break above current resistance will trigger another wave to the upside. Besides, the target level from the daily chart also corresponds to the 161.8% Fibs applied to the April 30 – May 15 ABS correction down.
The most interesting price action can be seen on the 30M chart, where NZD/CHF formed a triangle pattern. What is more important is the actual break above the triangle, confirming bullish sentiment. Also, we can see a clear rejection of the 61.8% fibs at 0.5920, making it a key support level. Therefore, as long as the price remains above this support, NZD/CHF should be expected to move up.
Potential Trade Idea: As per the 4H chart, the price remains below the Fibonacci resistance as well as the downtrend trendline. And to have the highest probability of success it is better to wait for the 4H break and close above 0.5950. But on the other hand, to get a far better risk-reward ratio, buyers could be stepping in already, because of the triangle pattern breakout. All-in-all the buying opportunity is open, but perhaps it is better to wait until Monday open in order to avoid any sort of market gaps after the weekend. Stop loss could be placed near 0.5888 or on the daily close below 0.5888. A potential target key level for setting take profit could be close to 0.6135.


Leave a Reply