Recent rejection of the 0.9692 resistance level could be providing a selling opportunity. Therefore as long as there is no daily closing price above 0.9724, USD/CHF is likely to initiate yet another move to the downside.
Disclaimer: The analysis presented in this article is for educational purposes only and should not be considered as financial advice.
This analysis was done on MetaTrader 4.
Click below to open a Free Demo Account with our trusted brokers:
Get a 30% deposit bonus with your new live AxiTrader account (only for non-US residents)
Trade Idea Details:
USD/CHF symbol
Type: Bearish
Key support levels: 0.9591, 0.9514, 0.9435
Key resistance levels: 0.9691, 0.9700, 0.9724
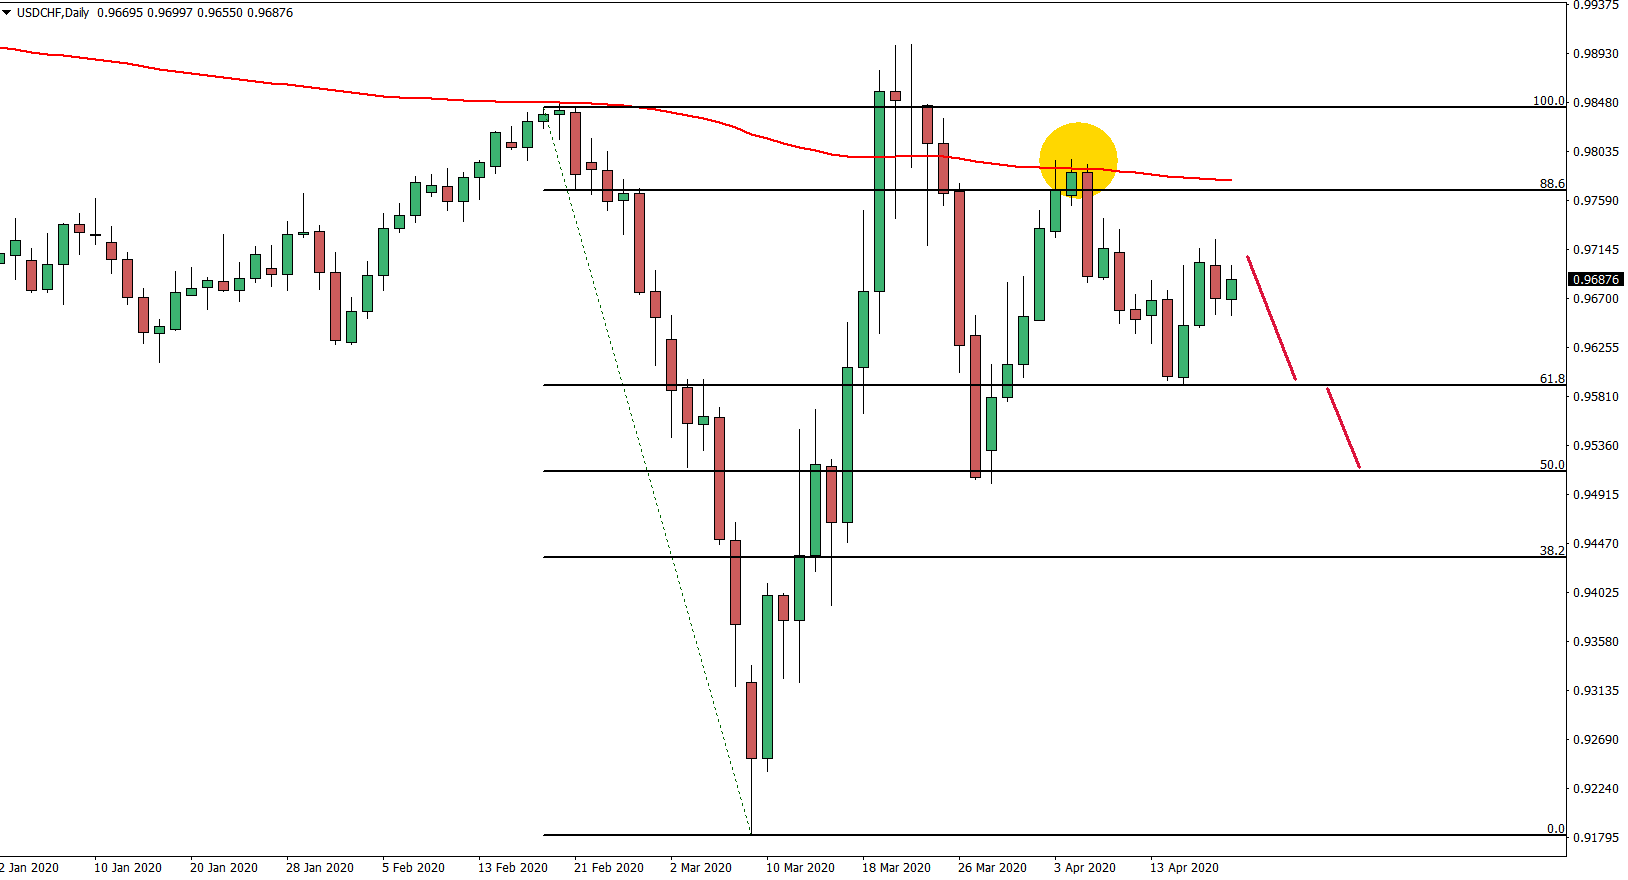
Price Action: USD/CHF has rejected the 200 Exponential Moving Average and broke below the 50% Fibonacci retracement level. On medium to long term perspective, this should result in a strong downtrend continuation, at least for the next few weeks.
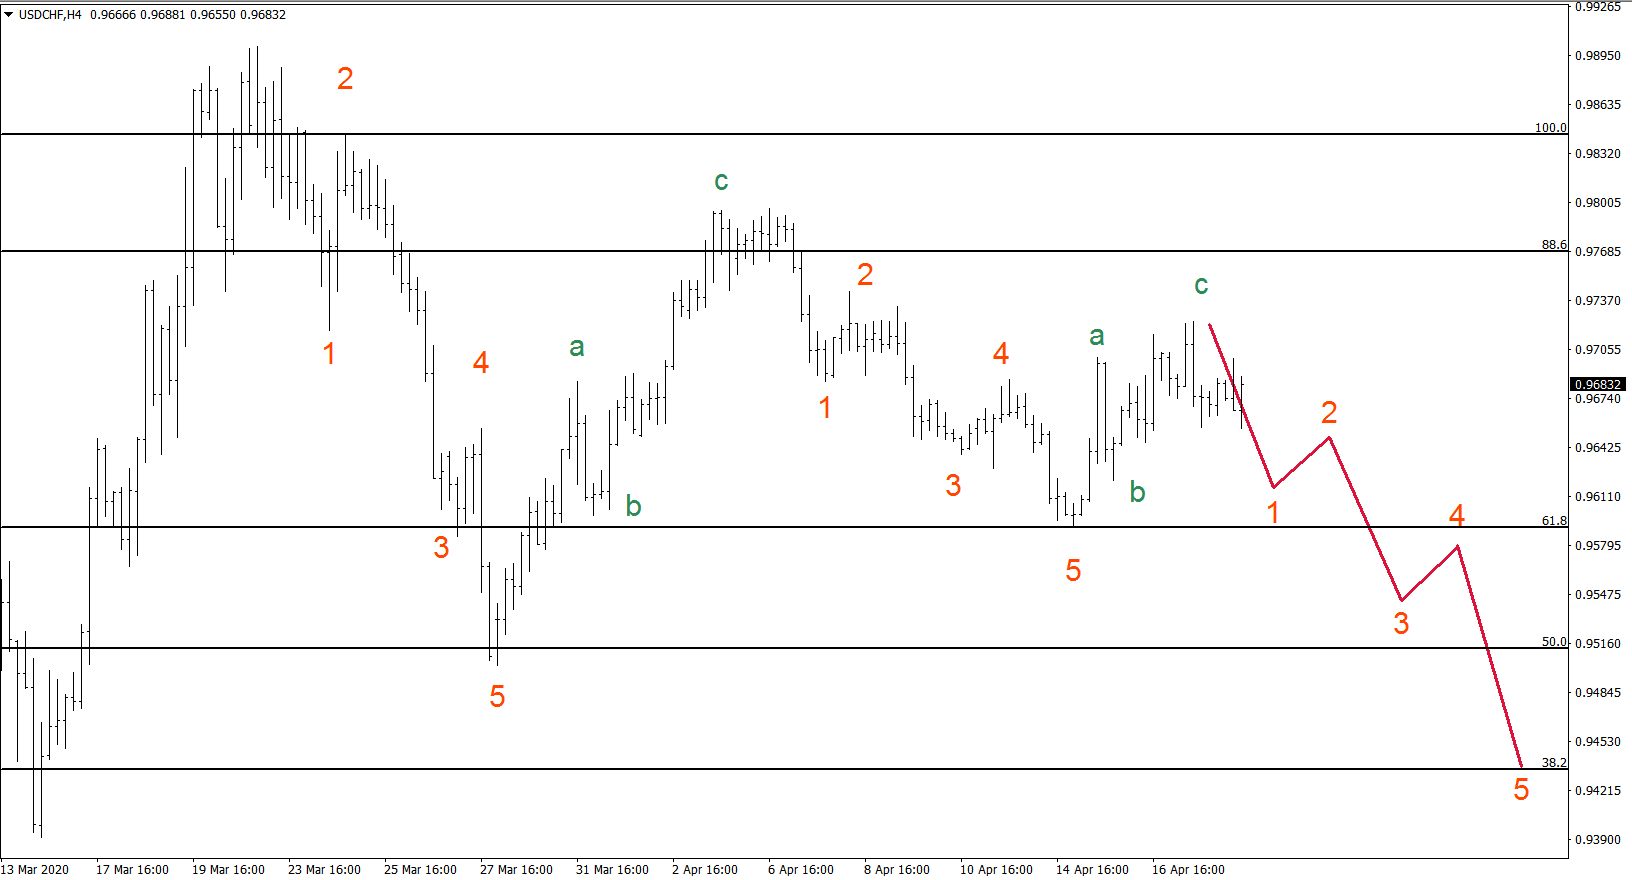
On the 4-hour chart, we have applied the Elliot Wave theory, where we can see that current move up, could be an ABC correction. Therefore, the main trend remains bearish and current corrective wave up could have ended, providing a long term selling opportunity.
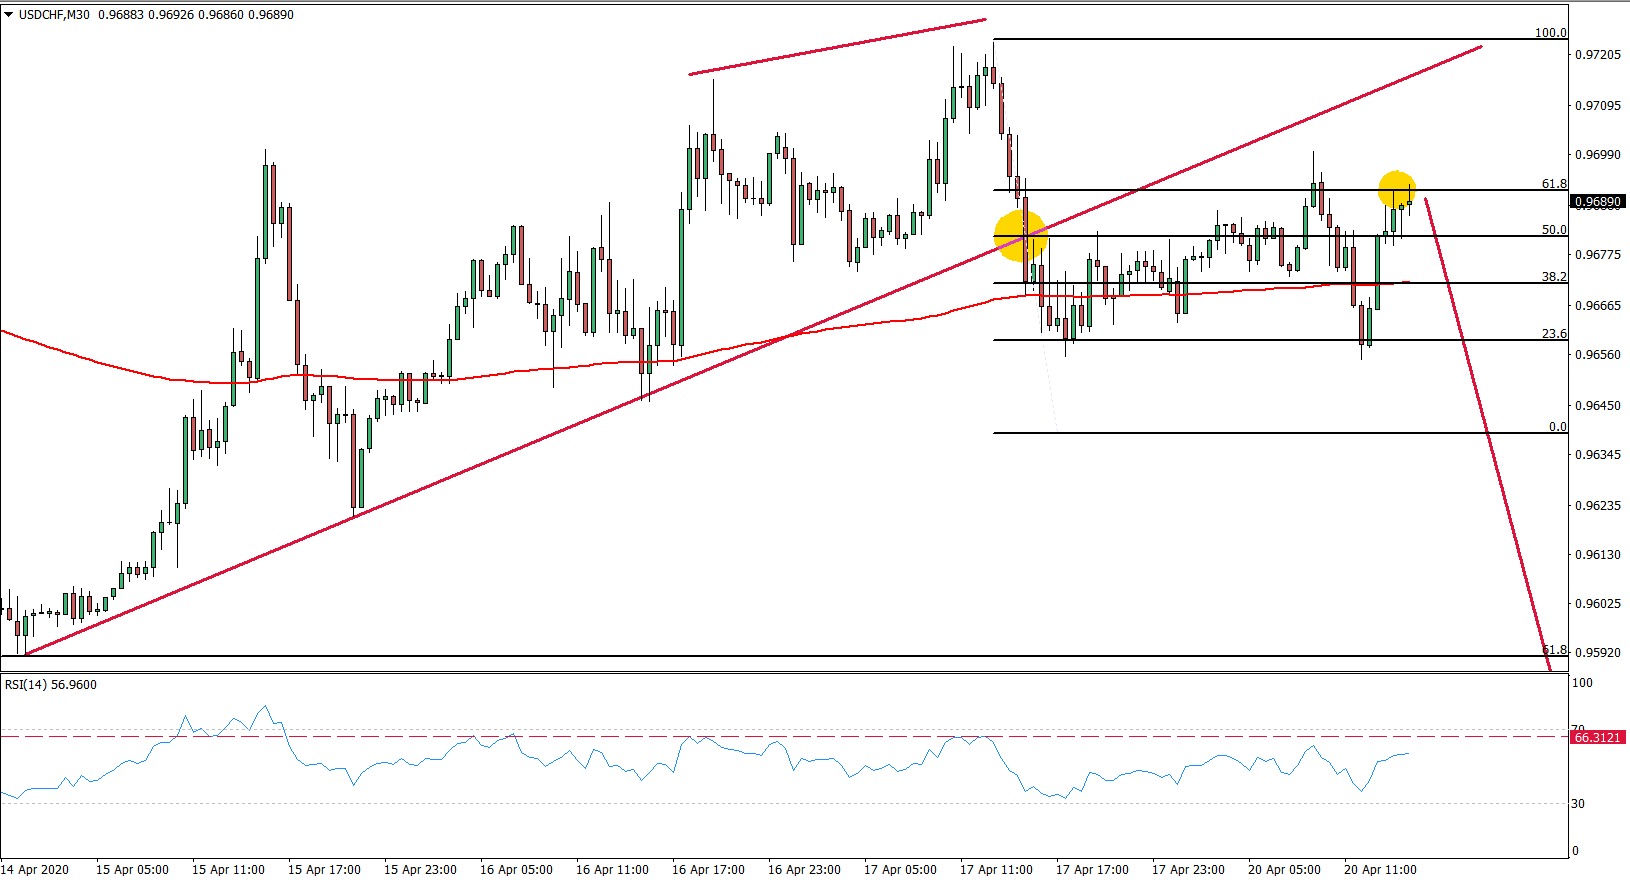
On the 30-minute chart, the RSI oscillator formed a bearish divergence, after which price broke below the uptrend trendline. Fibonacci applied to the trendline breakout point (where 50% retracement level is placed), shows that today USD/CHF has reached and rejected the 61.8% Fibs at 0.6992. This should result as the beginning of yet another wave down.
Potential Trade Idea: The 0.9690 – 0.9770 price area seems to be very attractive for sellers as well as long term investors. The first exit signal could be the break above the 0.9692 resistance, although the price could only spike above.
But if there is a daily close above 0.9757, it would be very likely to be the confirmation that the trend is reversing to the upside, and signal to exit the short trade. In regards to the downside potential targets, there are 3 of them based on Fibonacci levels from the Daily chart. First is 0.9590, the second is 0.9514, and the final target is 0.9434


Leave a Reply