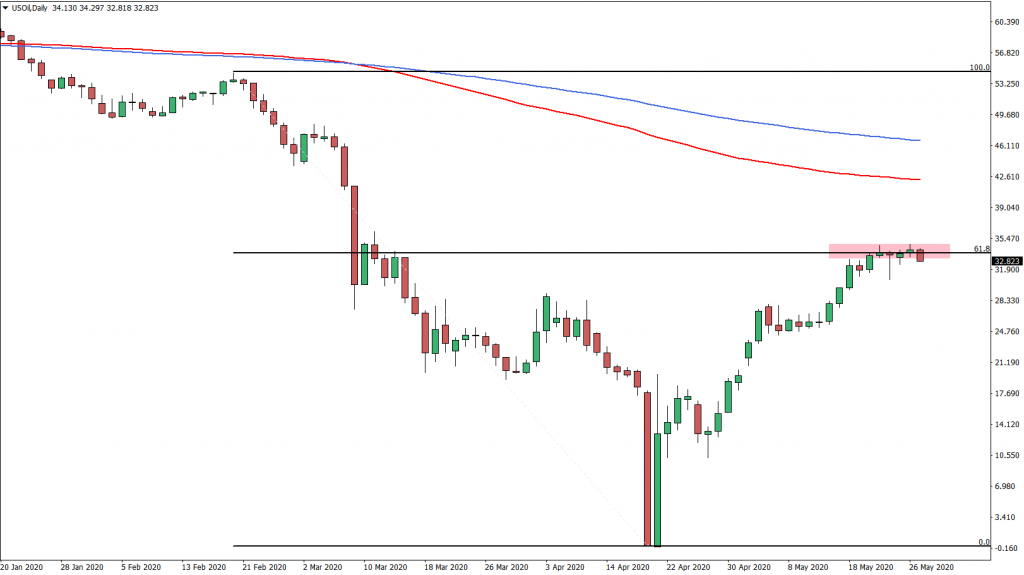
The USOIL uptrend seems to have exhausted itself after rejecting 61.8% Fibs on a Daily chart. Lower lows and lower highs are now being printed, confirming the validity of the downtrend in the short to medium term.
Disclaimer: The analysis presented in this article is for educational purposes only and should not be considered as financial advice.
This analysis was done on MetaTrader 4.
Click below to open a Free Demo Account with our trusted brokers:
Trade Idea Details:
USOIL symbol
Type: Bearish
Key support levels: 30.70, 29.50
Key resistance levels:34.60, 33.30
Price Action: On the daily chart USOIL has reached the key resistance level, which is 61.8% Fibonacci retracement level at 34.60. The resistance has been rejected clearly at first, then price attempted to break higher although only produces spike above and failed to close above the spike. This might suggest a very bearish sentiment for the USOIL in the long run, and clearly bears are strongly defending this resistance level.
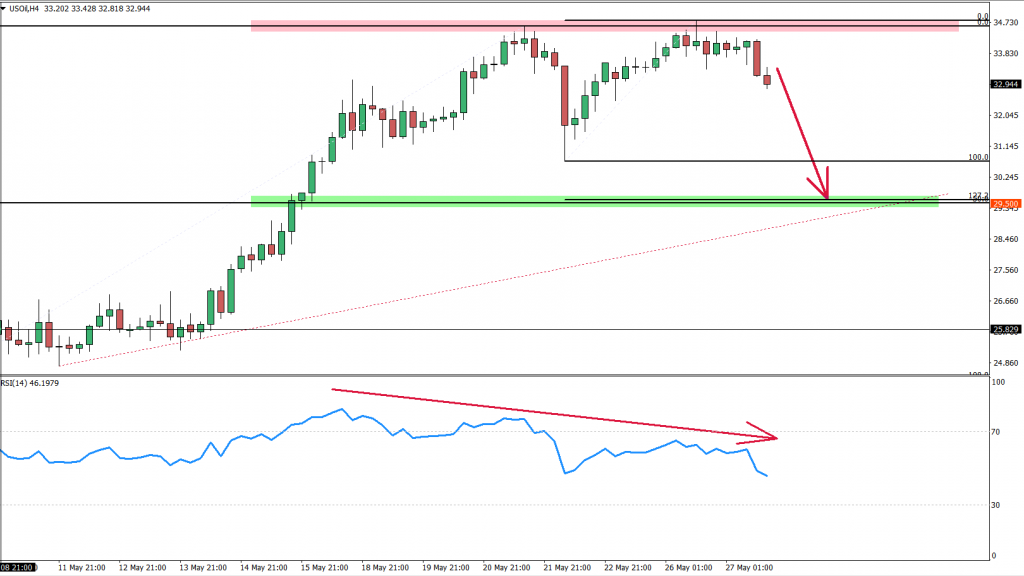
Looking at the 4-hour chart, we can see the formation of the double top near the 34.60 area. At the same time, the RSI oscillator formed a bearish divergence suggesting a potential trend reversal or a correctional move down at the very least. As long as 34.60 resistance is being respected, USOIL should be expected to move towards 29.50 support. This support level is confirmed by 50% Fibonacci retracement level applied to the last wave up. Also, it is confirmed by 127.2% Fibs applied to the last move where price formed a double top and the bearish divergence.
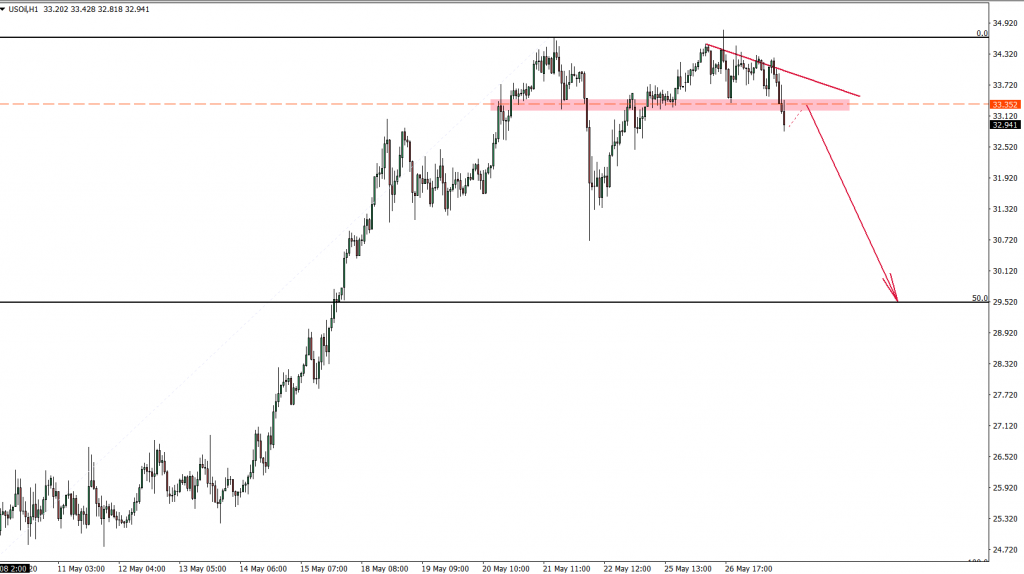
Finally, on the 1-hour chart USOIL price started to move lower while respecting the downtrend trendline. The most recent price action shows the break below the key support level at 33.35. This can be treated as a confirmation of the starting point of the correctional move down.
Potential Trade Idea: The key support was at 33.35, which today got broken. This means that price might re-test this level, making 33.00 area a strong supply zone. Perhaps it is best to wait for a correction towards this price area before going short. Stop loss could be placed near 35.05 and take profit at 29.70.


Leave a Reply