Price action trend reversal strategies are old as technical analysis. Before trading theories and indicators appeared, traders used naked charts to spot the best trade.
Technical analysis using price action is the purest approach to markets. Because there’s no indicator to blur the charts, trades become apparent.
Moreover, when applying money management rules, trend reversal setups result in mind-blowing trades.
Price action trading uses basic technical analysis tools. The following don’t miss from a price action trader’s arsenal:
- classic and dynamic support and resistance levels
- trend lines and channels
- pin bars and candlestick patterns
- classic technical analysis patterns
- head and shoulders
- wedges
- triangles
- flags
- double and triple tops and bottoms
Because price action trend reversal strategies offer great risk-reward ratios, we’ll address them here. As such, we’ll cover:
- best price action trading strategies
- how to use pin bars to spot a trend reversal
- confluence area with price action strategies
- price action around tops and bottoms
- market geometry as the best indicator in price action trading
However, above all, we’ll look at setting the best money management system. Therefore, the entry is critical. Next, the stop-loss as well. Finally, setting the take profit for a cool risk-reward ratio.
Price action is one of the best indicators that exist. You know, just looking at prices, you’ll learn more than from any indicator.
Savvy traders know the importance of putting the screen hours. It opens the gates to understanding the market like no Forex indicator does.
Both lower and more significant timeframes analysis help understanding price action. And, the beauty of the patterns that we’ll cover here comes from their simplicity.
What is Price Action?
When using price action, Forex traders just look at a chart. A plain, brand, new chart. With nothing on it!
For price action is precisely that: watching levels and “feeling” the pulse of the market. Naturally, some clues help.
Clues come from classical technical analysis patterns. We already listed the most important ones above.
As such, make sure you know what the rules are for trading them. Plenty of articles in our blog give you an educated guess on how to trade them.
Because many articles on the Internet already treated the subject from a theoretical point of view, we’ll use the opposite angle. The one closer to the trader. The real one.
Hence, we’ll use examples. Plenty of them.
Any other topic would be easier to explain, but price action needs examples. Moreover, trend reversal patterns derived from price action trading strategies make more sense on practical examples.
Before starting, keep in mind what we said in this article’s introduction. You already know the trading tools we’ll use!
Naked Chart Trend Reversal
The easiest way to illustrate how price action works is to use a naked chart. Therefore, let’s do that!
Below is the AUDUSD weekly chart. Mind the timeframe!
To be honest, there’s nothing to see here. Or, is it?
To the untrained eye, this is just mumbo-jumbo. Some green and red candles that don’t tell us anything.
Well, think twice, as price action gives us plenty of clues. Here we go…
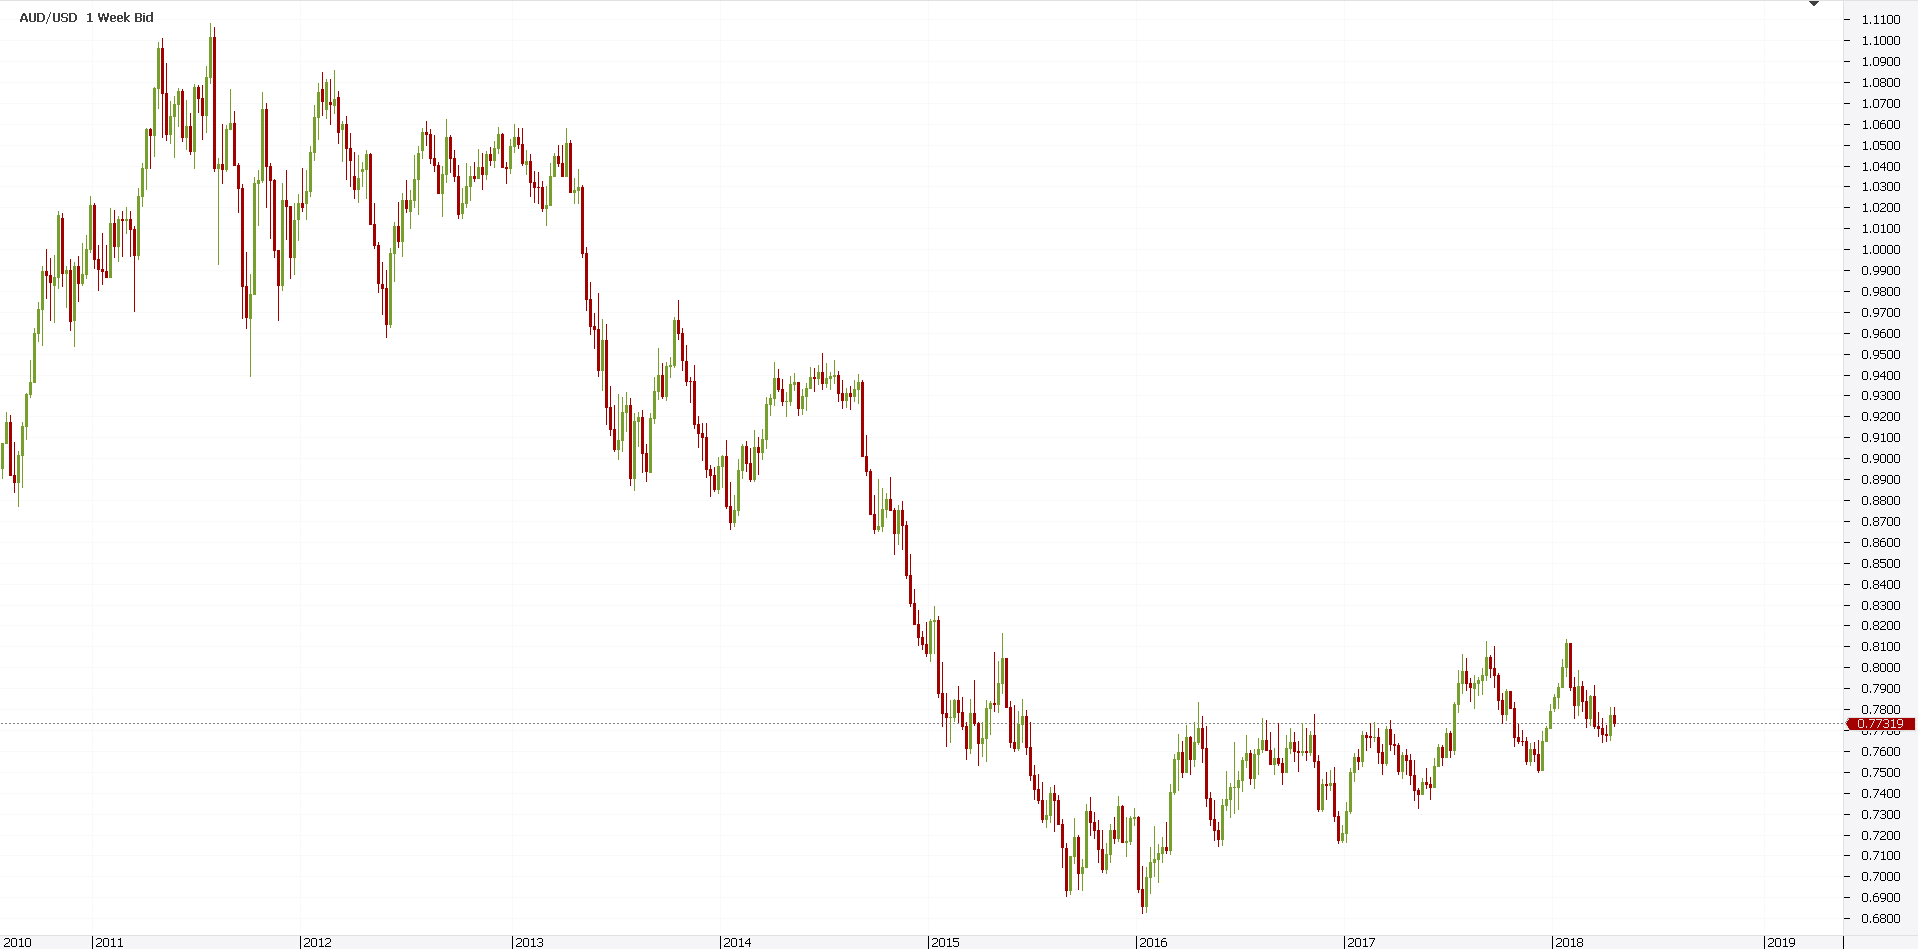
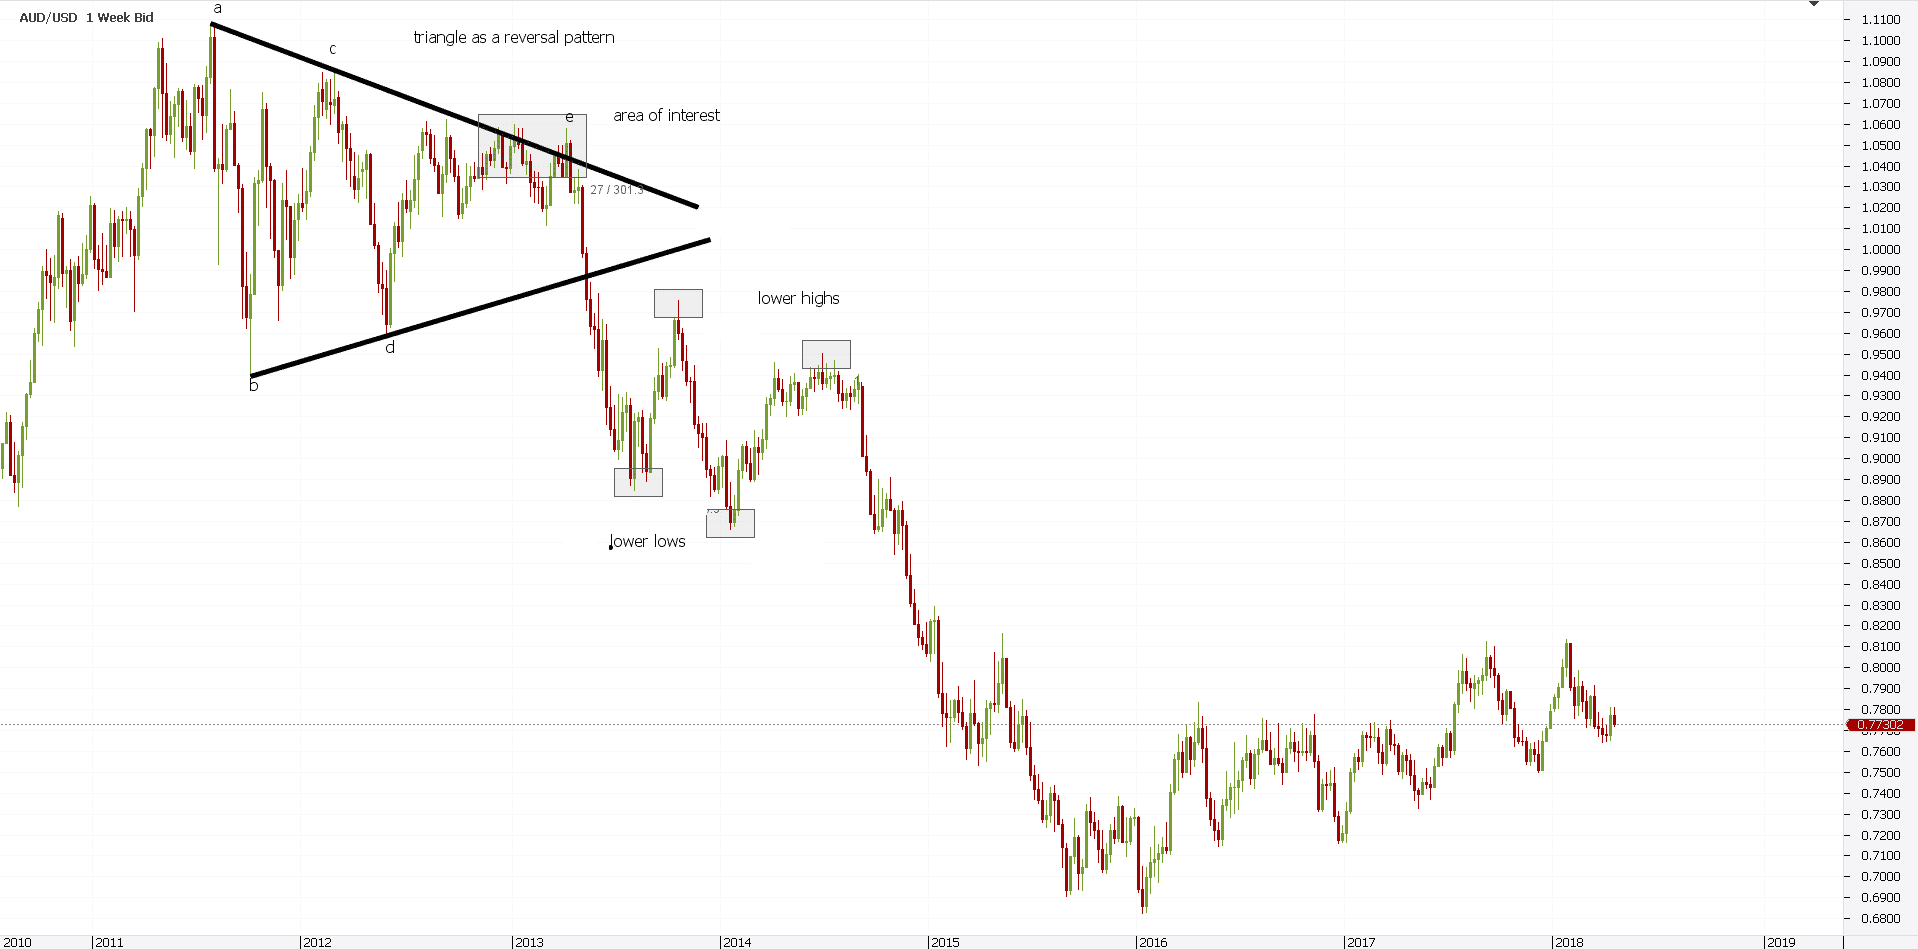
From left to right, the top of the chart points to one of the biggest trend reversals in the last years. When the AUDUSD pair broke lower from the parity level, many wondered what the support would be.
However, we do know one thing. As we see it with our own eyes, the price DID reverse.
The previous bullish trend turned. Hence, a trend reversal took place.
Before anything, let’s study a bit the area. Why would price turn there? Are there any clues we can use?
Yes, there are! Check out the price action a bit.
As bulls tried to push higher, again and again, they kept failing. That is, the market failed making new highs.
Instead, it made a series of lower highs. Not one, but five consecutive ones!
At the same time, bulls bought any deep. Aggressively!
But if we check the classic technical analysis patterns, what do we see? Is there a pattern that shows such a price action? A trend reversal pattern?
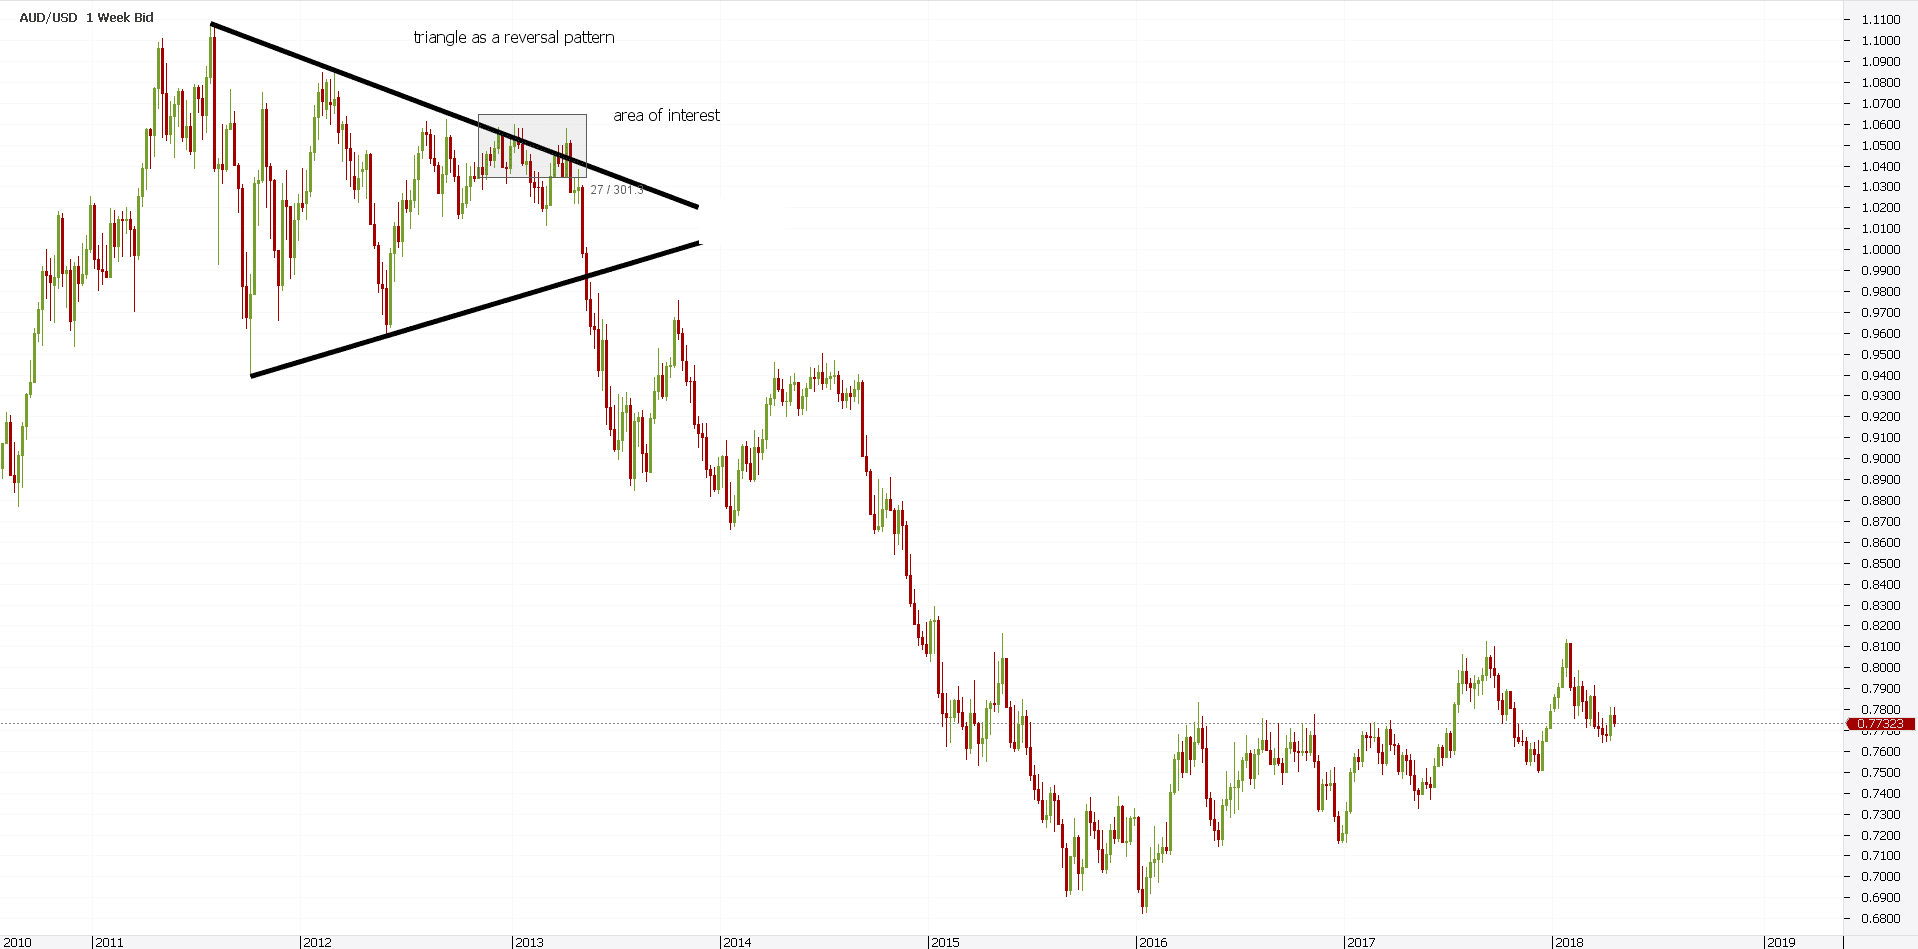
Oh yes, that’s a triangle. Any time you see the market making a series of lower highs and higher lows, a triangle forms.
Moreover, a break follows. The question is to determine the direction of it.
Triangles Indicating Future Price Action
Suddenly, we don’t look at a naked chart anymore. We have some clues about what’s to happen.
When they act as a trend reversal indicator, triangles respect specific rules. Elliott was the one to lay best down the rules of trading a triangle.
He said that we should label it with letters: a-b-c-d-e. Moreover, the b-d is the most crucial trend line.
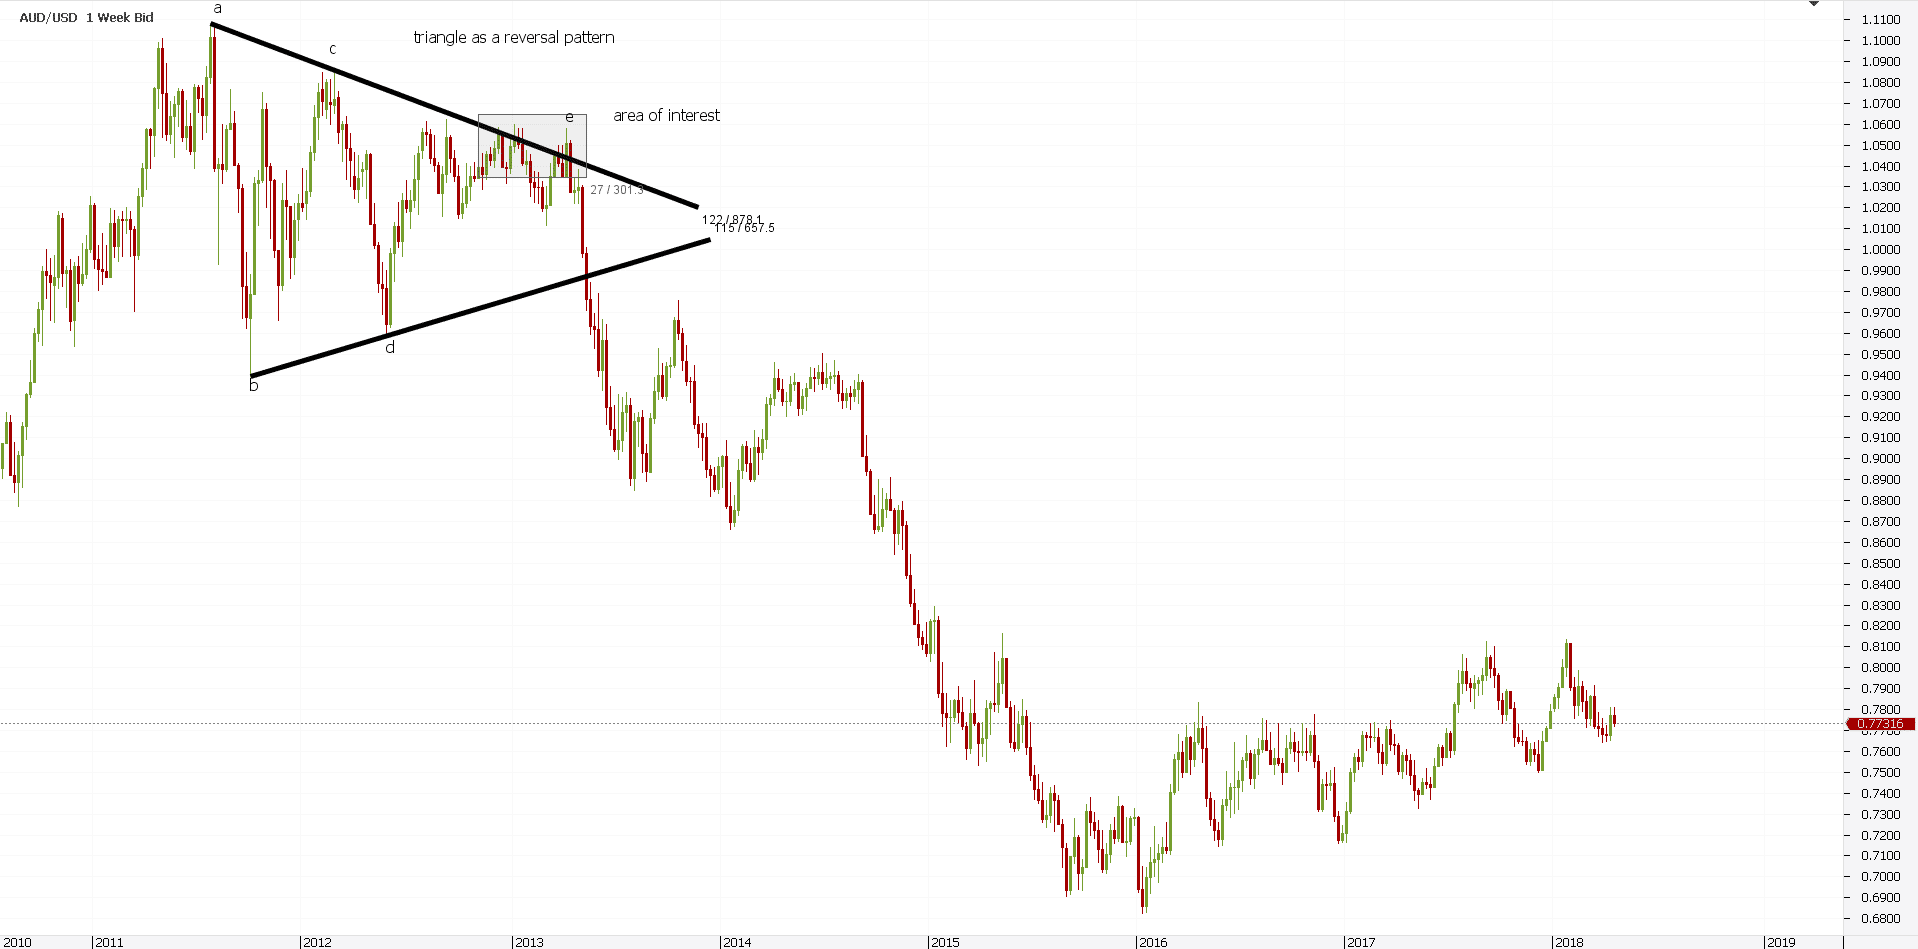
And, at the same time, when in a trend reversal, signals the a-c trend line’s piercing. Hence, that’s why the area of interest appears on the previous chart.
However, let’s not be picky here. Let’s assume we didn’t notice the bearish price action until the triangle broke.
Hence, we’re after the triangle broke lower. Or, here:
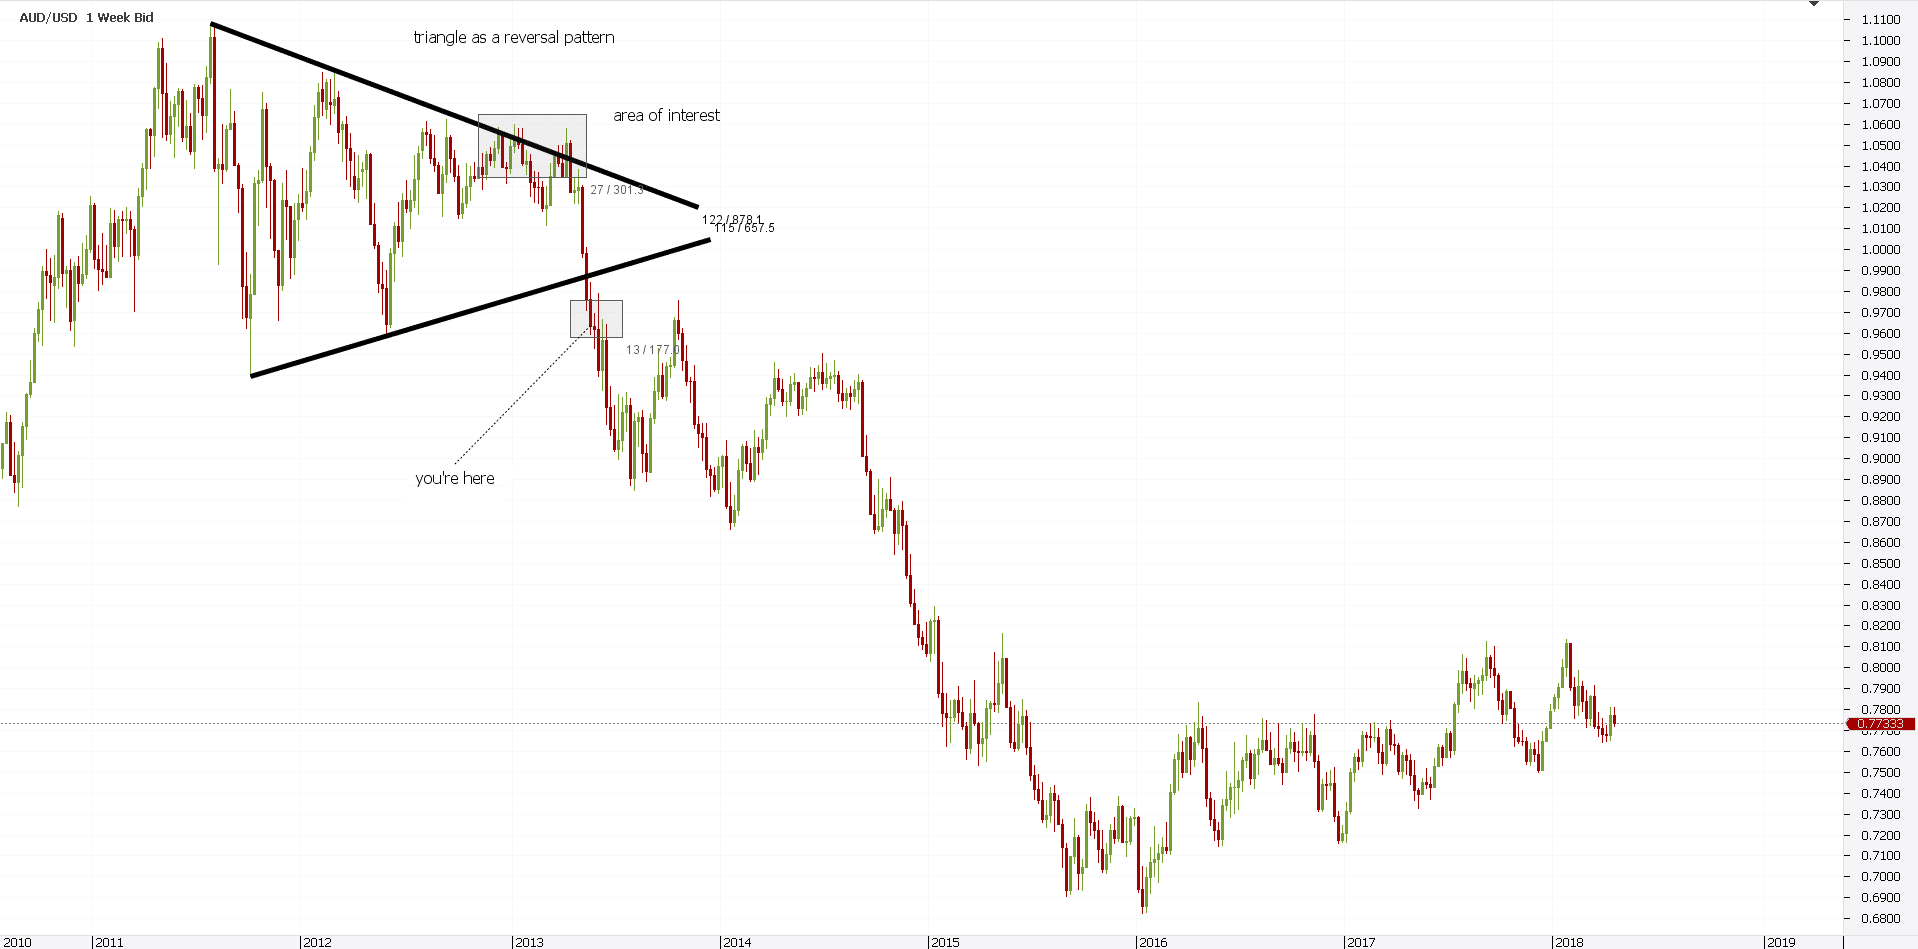
But, any price action trader knows one thing is clear now. This is a momentum trend reversal!
A bearish triangle like this one tells us a new trend started. Therefore, we need to mark the start of it (the end of the triangle) and take it from there.
The rules of engagement when dealing with a bearish trend force us to look at two things:
- the series of lower lows and lower highs
- the line of the trend
A rule of thumb in any price action trading strategy says the following: the trend will continue if the series is intact. Hence, don’t touch it! This is an expensive place to try to catch a falling knife!
Head and Shoulders as Trend Reversal Pattern
Now that we know the series of lower highs and lower lows is intact, we can sell. Plenty of it.
Hence, the bias is bearish, as the triangle’s trend reversal indicated long time ago. Check the second lower high on the chart above. What do you see? Isn’t it that a beautiful head and shoulders pattern?
Let’s zoom in to find out more:
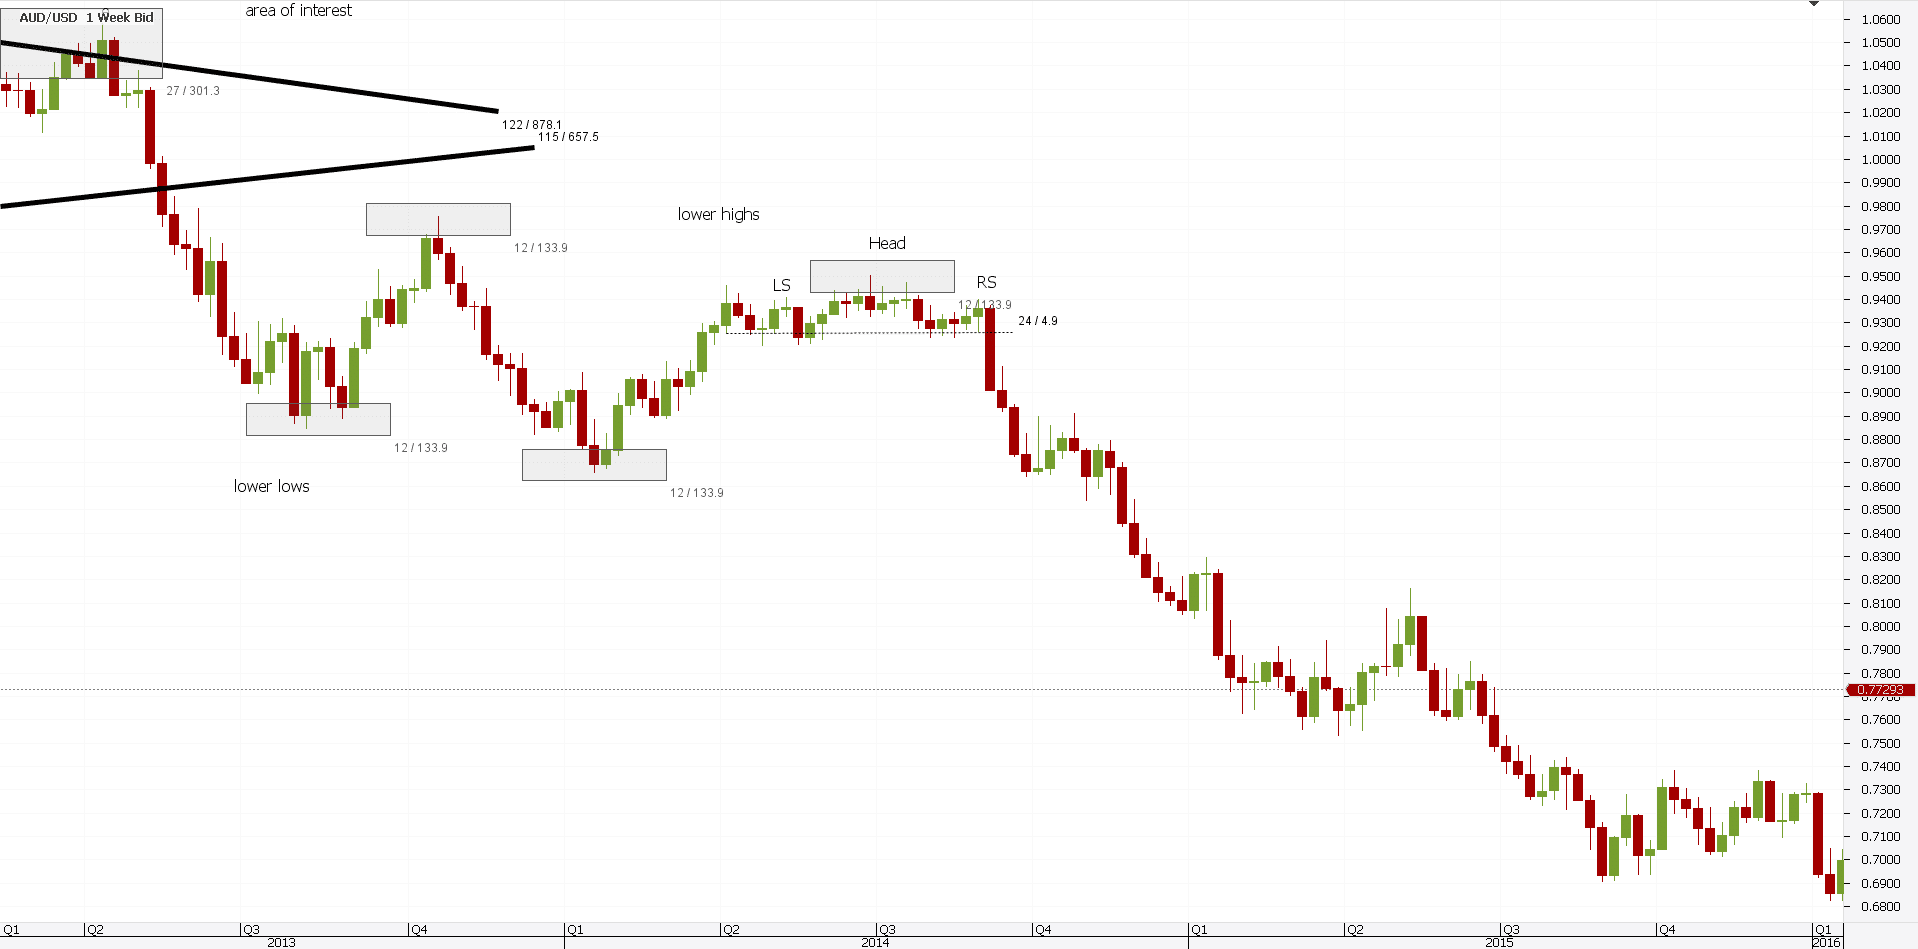
A closer look reveals a “by-the-book” head and shoulders pattern. Here’s a reminder of what it stands for:
- prior bullish trend present – check!
- left shoulder’s consolidation breaks higher – check!
- spike higher quickly retraced – check!
- right shoulder’s consolidation resembles the left shoulder’s one – check!
All we need to do next is to draw the neckline and wait for the break. This is a great way showing how to identify a trend reversal.
Dynamic Resistance Part of Bearish Price Action
When price meets support or resistance, it does that in:
- a classic way – on the horizontal
- a dynamic way – the support or resistance follows the price action
Dynamic support or resistance needs a trendline. That is the line of the trend.
Because we already established the conditions for a bearish trend are still in place, we need to draw its trendline. For this, we must know:
- the end of the previous trend. That’s easy, as the triangle acted as a trend reversal pattern!
- the last lower high after the market made a new lower low. We already have that too!
Armed with the two points, we can draw the line of the bearish trend. Here we go:
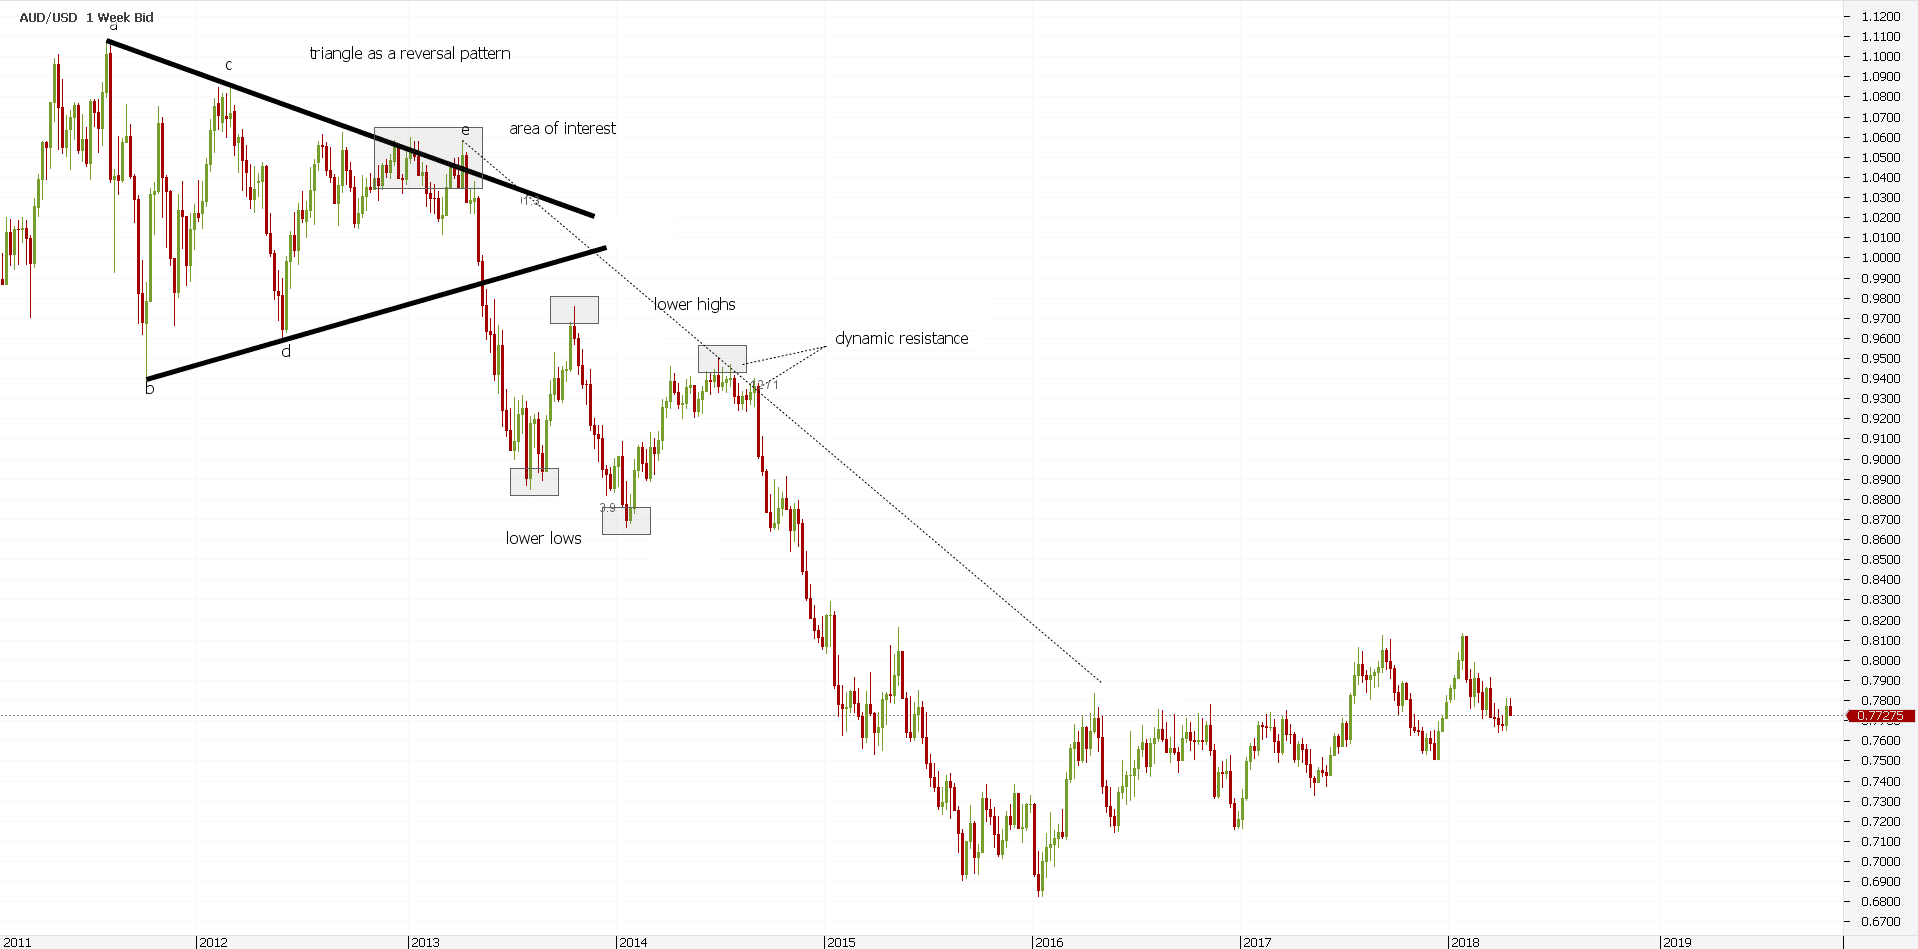
By connecting the two points and dragging the trendline, we established the trend. It is now visible, handsome, and full of opportunities.
So far, we said the head and shoulders pattern acted as a nice trend reversal pattern. How about the trendline?
Keep in mind the timeframe we analyze. The weekly chart!
Quickly after the second point that gave us the trendline, the price consolidated for nine consecutive candles. Or, nine full weeks!
There’s no excuse to miss this one. Together with the head and shoulders pattern, the dynamic resistance forms a confluence area.
A confluence area is difficult to break. That is, more difficult than a single trend reversal pattern.
Triple Tops as Trend Reversal Price Action Indicators
A triple top’s definition says that the market hesitates at the same place. Three times it does that, before reversing.
After a bullish trend, that’s bearish price action. There’s even an mt4 trend reversal indicator that finds potential double and triple tops patterns! They’re so obvious!
But today’s Forex trading changed. It changed so much that the patterns changed too.
When the double and triple tops were documented on the stock market, the price action differed. Today, we talk about five-digit quotation and super-fast and reliable execution.
Hence, a triple top, for example, doesn’t refer anymore to a fixed level, but to an area. That is an area where the price hesitates before turning.
A closer look at the earlier head and shoulders pattern shows the price hesitating. Moreover, it does that almost at the same level.
That’s bearish and good enough to be a trend reversal triple top pattern in the currency market.
Let’s review the four things pointing to go short at the second lower high:
- second lower high
- head and shoulders as a trend reversal
- triple top as bearish price action
- dynamic resistance against the trendline
And, a closer look shows even a pin bar forming against the trendline. That’s the fifth trend reversal pattern in a row!
The price continues to fall, making lower lows and lower highs. Suddenly, something happens.
Before any trend reversal, the price action must break the previous trend’s series. In the AUDUSD case, the previous trend’s lower high.
Not only that it did that, but the area worked as classic support this time. Moreover, bullish price action followed. Eventually, the primary trendline broke.
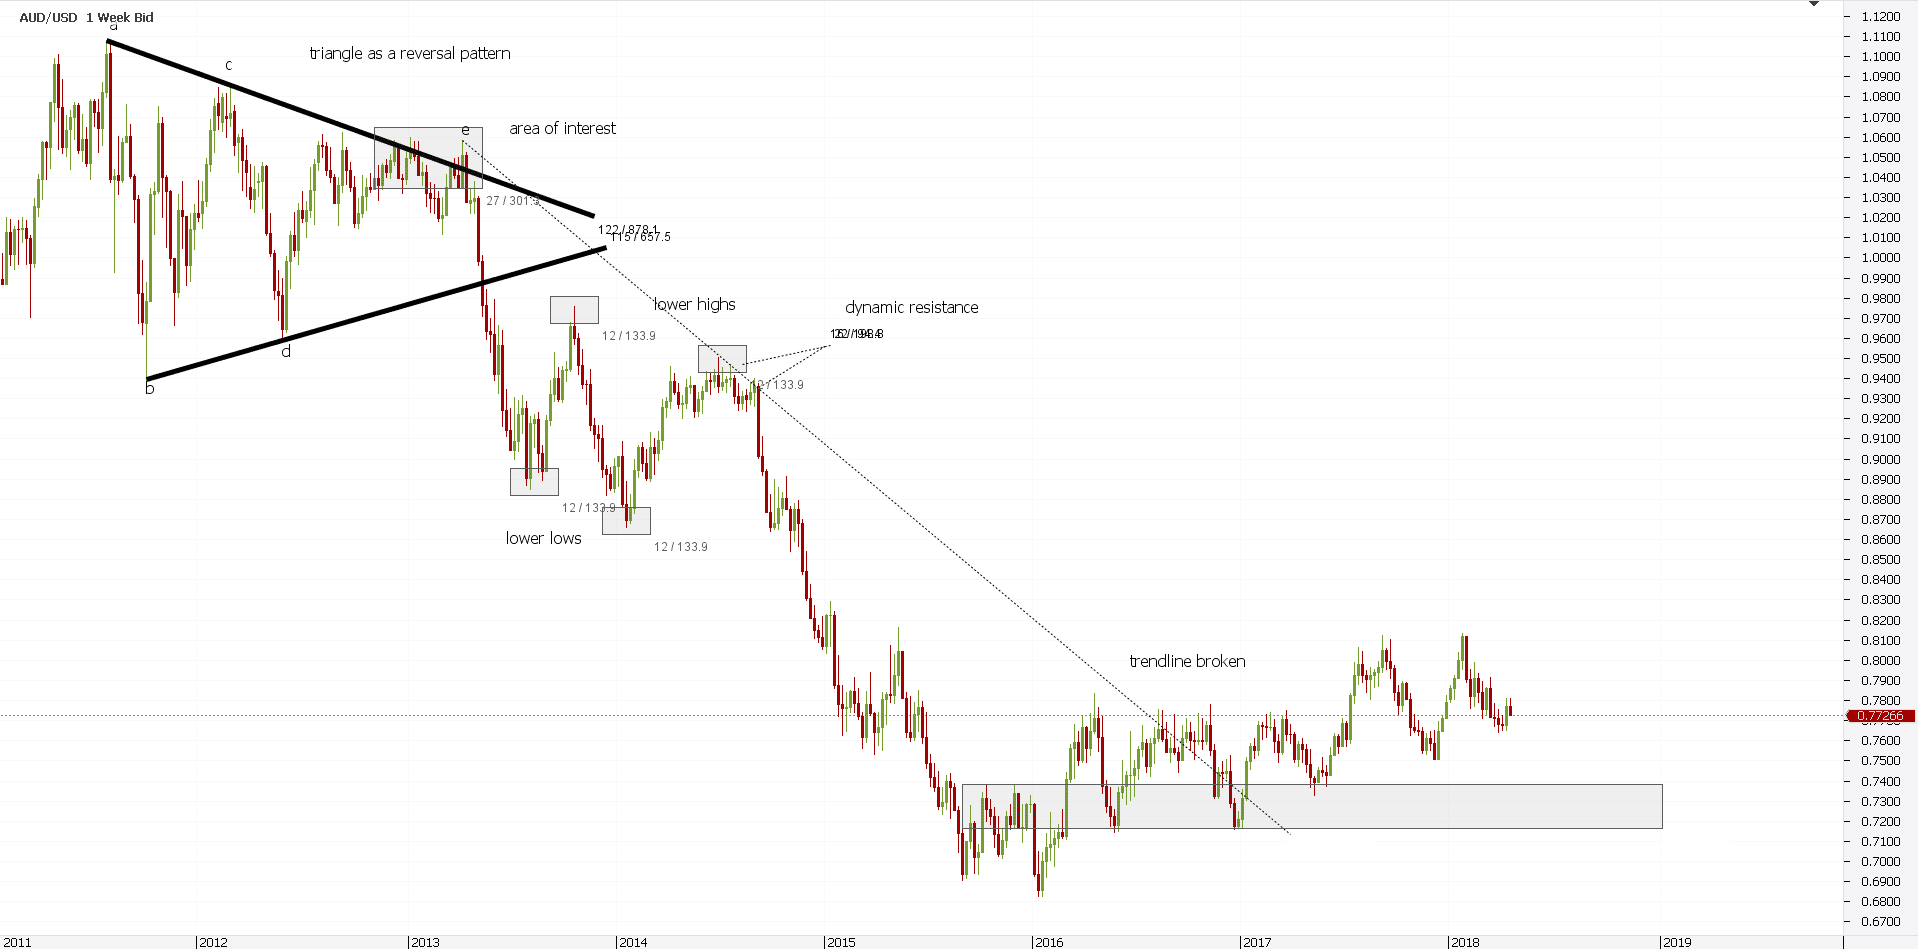
Mission accomplished, as we showed how to trade reversal patterns both after a bullish and a bearish trend. What next?
Rinse and Repeat – Price Guide for Future Price Action
At this point in the article, please go back to the start of it. Look at that naked chart and check how it is now.
The difference is that we used only a logical approach to price action. No trend indicators, no oscillators, no trading theories…nothing but pure price action.
Moving forward, the process repeats. Any bearish trend will reverse eventually, even if only on lower timeframes and only for a while.
The bullish trend that follows will reverse too, and so on. Rinse and repeat, following basic technical analysis patterns.
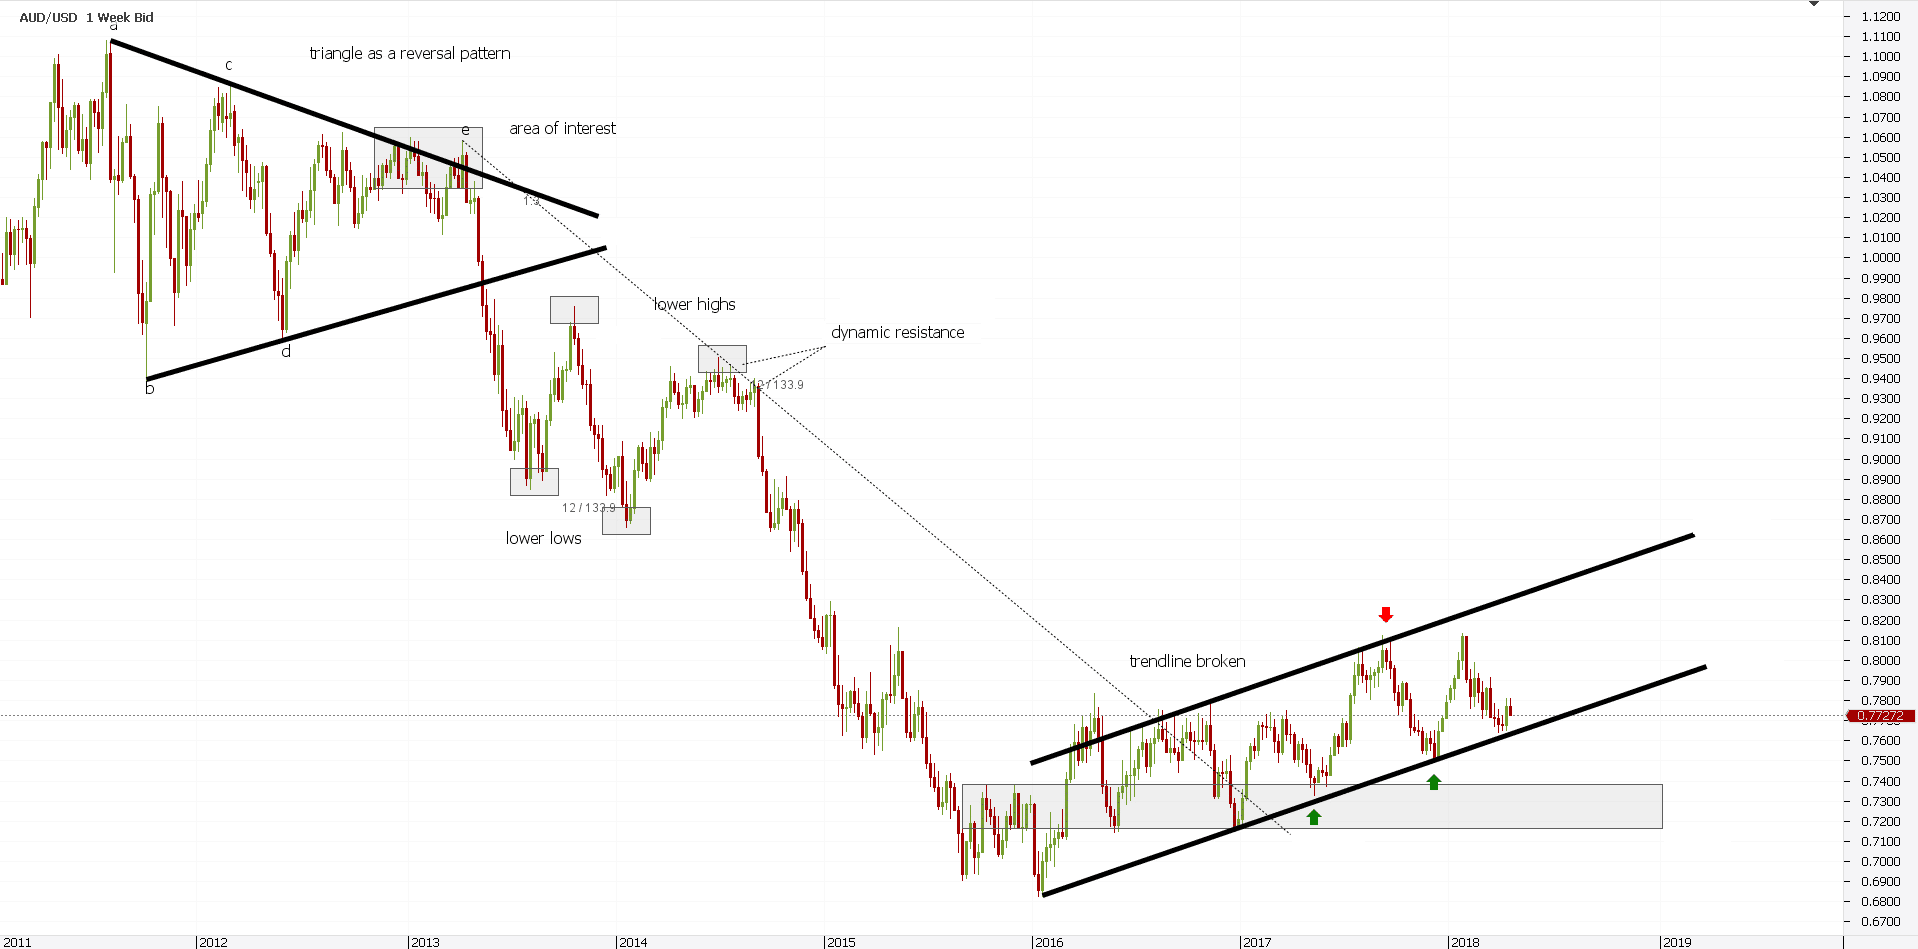
A quick look at the last two and a half years’ worth of price action on the AUDUSD weekly chart, and we see a rising channel. Again, another classic technical analysis pattern derived from the same trending series.
At this point you can imagine that one the left side of the bearish trend reversal triangle we started with, similar patterns formed. The point is that a logical approach to trading allows finding great trades.
The only thing that misses is money management and all that comes with it: patience, discipline and proper risk-reward ratios.
Money Management Rules in Price Action Trend Reversal Trading
All patterns presented here were already discussed on our blog. Feel free to search for the rules of trading them.
For a better understanding of how price action impacts the trading results, here’s a quick guide to proper money management.
Triangles
Triangles deserve a special place in any price action analysis. Because they form so often, the simplest way to trade them is the following:
- find out the most extended leg (typically it is the first or the second segment)
- project it from the b-d trendline’s break
- trade the b-d trendline’s break, with a stop loss at the previous swing high/low
- target a risk-reward ratio of at least 1:2
Head and Shoulders
For this pattern, it is all about the neckline. Measure the distance between the neckline and the highest/lowest point in the head.
Next, project it from the neckline in the opposite direction of the previous trend. Finally, stay for the measured move and then trail the stop. Aim for a risk-reward ratio of minimum 1:2.
Triple Tops
Despite failing most of the times (they resemble ascending triangles), they do work when coupled with other bearish patterns. As we proved here, at least three different factors suggested the triple top will work.
Because of the relatively close levels, draw a horizontal line below the three tops. That’s the equivalent of the head and shoulders’ neckline.
Next, measure the move from it until the highest point in the pattern. Finally, project it for a minimum 1:3 risk-reward ratio.
The need for a higher rr ratio comes from the relatively small risk taken.
Resistance Against a Trendline
Either dynamic or classic, resistance is a good indicator of price action. Use it in strong correlation with the lower highs series.
Even if price breaks the trendline, it means nothing for the bearish trend. However, if it breaks the trendline AND breaks the lower highs series, bears have a problem.
If not, the simplest solution is to adapt the trendline to the new reality. Effectively, wait for the price to make a new lower low. Next, adjust the trendline to the new reality.
Pin Bars
While barely mentioned in this article, the pin bar is a strong trend reversal pattern. That’s especially true on big timeframes like the one studied here – the weekly chart.
But there is a reason why we didn’t look at a pin bar for more details. We already covered it on a different topic: a hammer or a shooting star.
That’s right; a pin bar is nothing but the Western approach to the Japanese hammer and shooting star pattern. Hence, for the money management rules to trade them, please refer to the dedicated article
Conclusion
As the purest form to interpret a chart, price action has many followers. Traders from all backgrounds find it easier to look at a chart and understand a potential trend reversal.
The beauty of price action strategies is that they act as continuation patterns too. While this article focused exclusively on trend reversal patterns, continuation ones work too.
Moreover, everything shown here works on the lower time frames as well. Even Forex price action scalping is possible on five-minute charts or even lower ones.
All in all, price action is a part of technical analysis everyone loves. But, few understand it.
The troubles appear when integrating the patterns. While traders know to recognize a head and shoulders, for example, they don’t know how to incorporate it into a money management system.
Because trading is mostly automatic these days, robots and trading algorithms will try to overtake apparent patterns. Hence, the stop loss is mandatory.
Next, without a risk-reward ratio that makes sense, traders will fail. The problem is that on bigger time frames (and not only), traders don’t have the patience to wait until the target derived from the risk-reward ratio comes.
Finally, price action screams at you. When price hesitates, it is impossible to ignore it. As such, we hope this article gives enough clues on how to act.
START LEARNING FOREX TODAY!
- Chart patterns
- FOREX
- Forex Analysis
- FOREX trading
- Price Action
- reversal patterns
- Trend
- trend reversal
share This:


Leave a Reply