This time I am proud to show you the longest trade I have on record. It took place on the AUD/USD Forex chart and I opened it on signals from the Forex Alligator. I used the basic signals of the Alligator indicator trading system, which got me into an emerging bearish trend with the Aussie. But first, let’s […]
In this live Forex trading example I use the Relative Strength Index a.k.a. RSI indicator to discover a trading signal. The video shows how to trade a bearish divergence RSI signal in a combination with price action. Signals of the Bearish Divergence RSI Trade The general price action is increasing, while the RSI indicator line […]
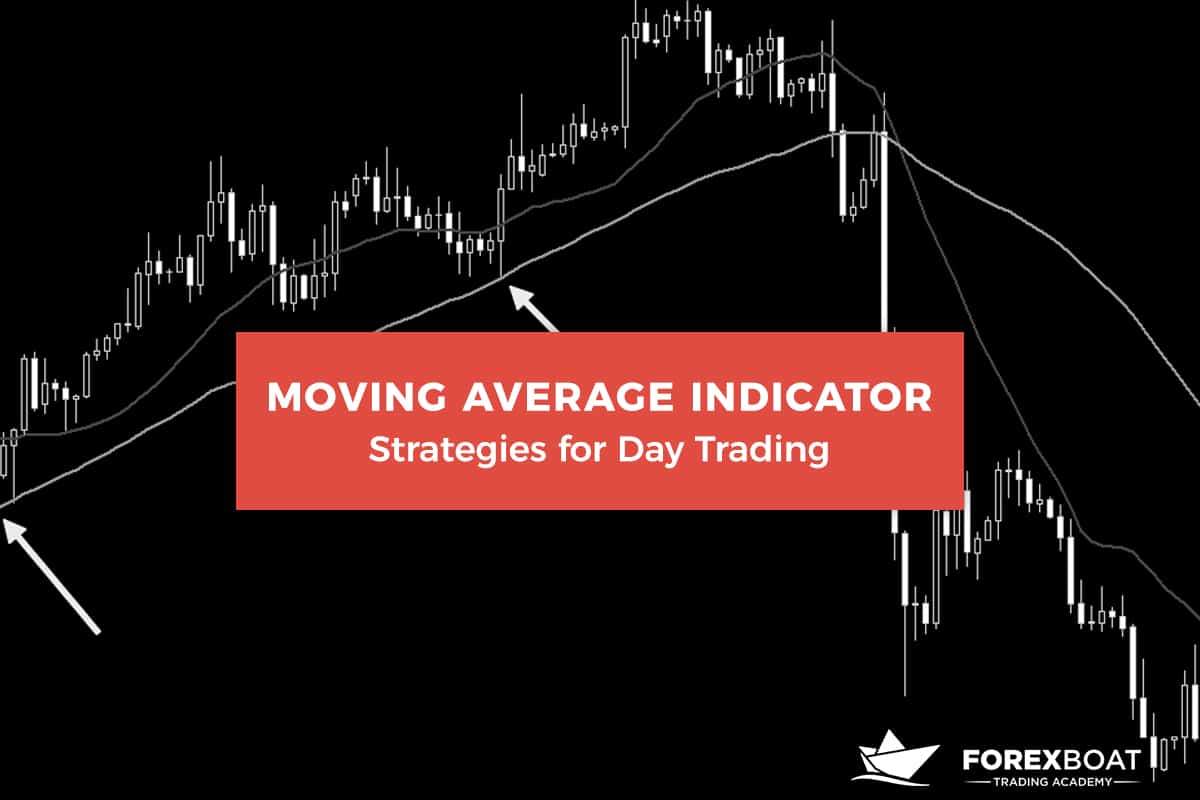
The Moving Average (MA) is a trend indicator. Like any other trend indicator, moving averages add to the actual chart. This is where the price action takes place. In this article we will go through the best moving average strategies in Forex. Many trading platforms place an oscillator at the bottom of a chart, in a separate window. This […]
This time we combined a 10-period and a 20-period Simple Moving Average indicators with the Volume indicator. We managed to recognize signals from these tools and to do a successful long trade in the USD/JPY chart. Live Trading Example Moving Average and Volume Indicator Signals The 5-minute chart of the USD/JPY shows a price increase […]

This time I decided to use a leading indicator for my live Forex trading video example. Today I will show you how the Stochastic Oscillator Forex trading works. Notice that the indicator is attached to the bottom of my chart and I use it in combination with price action to attain signals on the chart. […]
This is a live Forex trading example that shows how to forecast bearish impulses with the Descending Tops and Bottoms chart patterns. The video shows the Descending pattern in a combination with a Forex Resistance to foretell turning points and shifts in the forces on the chart. Bearish Signals Used for the Short Trade The […]

The Bollinger Bands indicator is perhaps the most popular trend indicator when analyzing a currency pair. Like any trend indicator, it is applied directly to the chart. Also, it is mostly used to find entries for riding a trend. These could be buying dips in a rising trend or selling spikes in a falling one. […]
This live Forex trading example combines two important events on the 5-minute chart of the GBP/USD Forex pair. This is the interaction with a Forex resistance and the followed channel breakout. This created a nice short trading opportunity on the chart, which I took advantage of. Signals of the Short Forex Resistance Trade The GBP/USD […]
This live Forex trading example involves a bullish trade taken on the M5 chart of the GBP/USD based on signals from the Bollinger Bands Forex indicator. The trade gives a clear example how to take advantage of Forex volatility when identifying emerging trends. I opened a long trade on the assumption that a bullish move […]


